1. Introduction
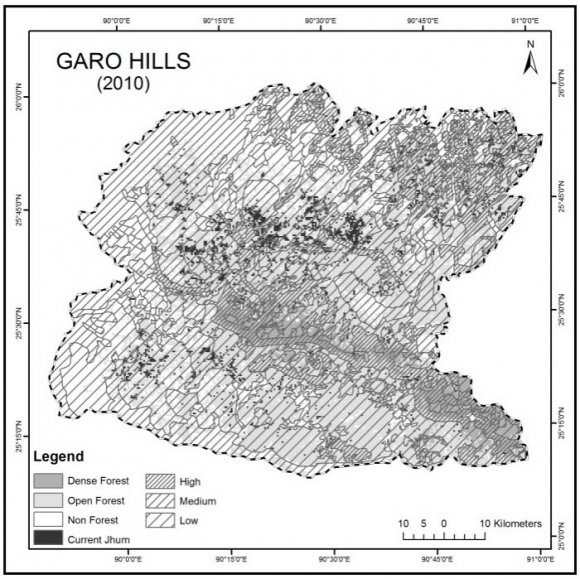
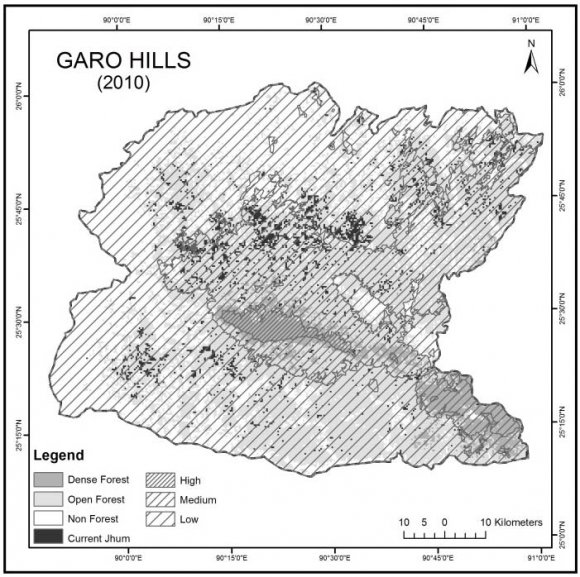
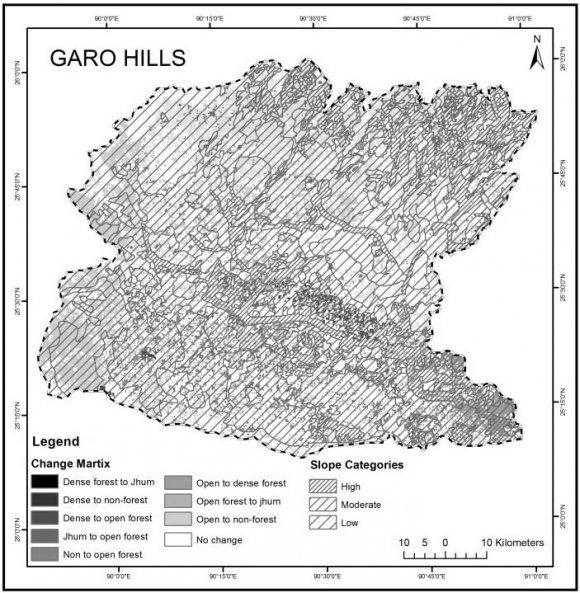
andscape dynamic is concerned with the effect of spatial heterogeneity on ecological process. The physical environment including climate, geology, topography, plant succession, species extinction and evolution is often regarded as one of the most important factors controlling this heterogeneity of the landscape in mountain areas. Disturbances like shifting cultivation, landslide, floods, deforestation, urbanization, forest fire, and the ecosystem modification are responsible for landscape dynamics (Zimmermann & Eggenberg, 1990). Land use/ coverstudy shows present as well as past conditions of the earth surface and it is a central component and strategy for managing natural resources and monitoring environmental changes (Yadavet al., 2012a). Landscape ecology is the study of patterns and structures across temporal and spatial scales. Spatial patterns observed in landscape result from complex interactions between biotic and abiotic processes and disturbances that occur within environment (Turner et al., 2001). As changes occur in the landscape, the overall structure and composition of ecological community is affected, hence the importance of the study related to landscape is increasing for maintainingthe ecological diversity. Among different environmental factors that produce landscape patches slope and elevation are important parameters that provide varieties of topographical features (Sarma and Barik, 2010). The study of the slope is important not only it provides the variety of topographical features but also provides evidence for the interpretation of complex form of the existing landscape and reflects the evolutionary history of the landform (Fairbridge, 1968). Elevation pattern of landscape have been responsible for many factors like climate, isolation, species-area effects, historic events and biomass productivity of landscape patches (ICIMOD, 2000 andAcharyaet al., 2011).Vegetation is one of the major factors controlling soil erosion, while most soil erosion occurrences are due to removal of vegetation and topsoil (Bochet and Fayos, 2004 and Yadavet al., 2012b). The shifting cultivation accounts for 60 percent global forest loss each year (Leleet al., 2008) and in northeast India annual forest loss is about 10,000 sq.kmdue to this unhealthy practice. The total area affected by shifting cultivation (locally known as jhum) in northeast is estimated to be 44,000 sq.km (Singh, 1990). The jhum cycle in northeast has been decreased from 20 to 30 years in the past to about 5 years (Toky and Ramakrishnan, 1981)and in many areas even up to 3-5 years (Sarma, 2010a). Vegetation and land characteristics of Garo hills of Meghalaya, northeast India are heavily influenced by jhum activities (Figure 1 Remote sensing and geographical information system (GIS) coupled with computer programs allow to use landscape ecological principle for biodiversity characterization more efficiently (Yadavet al., 2013). This technology has improved the efficiency of land use/ cover mapping and change detection with respect to slope and elevation pattern at landscape level. Digital Elevation Model (DEM) is a potential tool for terrain analysis at the varied spatial and temporal scales. The objectives of the present study include generation of slope and elevation maps of Garo hills districts of Meghalaya, preparation of land use/ cover maps for two different decades and to examine the dynamic relationships of slope and elevation with land use/ cover using temporal remote sensing data.
2. Study Area
The Garo Hills of Meghalaya consist of three districts viz., East Garo Hills, West Garo Hills and South Garo Hills (Figure 2). The districts are bordered in the north and west by Assam state, south by Bangladesh and east by West Khasi Hills district of the state. The districts are highly dissected with irregular terrain. The highest point of Garo hills is theNokrek peak with an altitude of 1,412m above msl. The total area of Garo Hills districts is 8,167 sq. km, which is 36.4 percent of the total area of the state (Sarma, 2010b). The soil of the districts is red loam and is poor in silica but rich in clay forming materials. The soil is generally loamy but often found clay to sandy loam. The surface horizon which is about 30 cm thick has colours ranging from reddish brown to dark reddish brown. The soils are rich in organic matter and nitrogen but deficient in phosphorous and potassium and they are acidic in reaction (Sarma and Barik 2012)
3. Materials and Methods
For landscape dynamic study temporal remote sensing imagery of 2001 and 2010 were utilized while for generating digital elevation model 2001 base year was considered (Table 1). The satellite images with bands (7) were stacked to prepare an FCC of bands 3(Red), 2(Green) and 1(Blue). The relevant topographic maps and image were geometrically rectified in 1:50,000 scale using geographic projection system UTM; speroid and datum used were WGS 84 with UTM zone 45N. The GIS and image processing software used are ArcGIS 10, Erdas Imagine 2011 and Quantum GIS 1.6. The paradigm for the study is described in Figure 3. Field verification was carried out during 1 st February to 11 th April 2012. Accuracy assessment of the classification schema is given in Table 2.
4. Results
Four land use/cover classes viz., dense forest (more than 40% canopy cover), open forest (10% to 40% canopy cover),non-forest (less than 10%) and current jhumhave been delineated for the study area (FSI, 2005). For slope three categories of high (above 14 degree), moderate (6 to 14 degree) and low (below 6 degree) are considered. Accordingly for elevation high (above 900 m), moderate (300 to 900 m) and low (below 300 m) categories are fixed.
It is found that in both the years the area under open forest (6,365 sq.km and 4,307 sq.km) has the maximum coverage which is followed by non-forest area (2,155 sq.km and 2,846 sq.km). There is a decrease of 2,058 sq.km open forest during the period while areas under non-forest increased by 1,591 sq.km. The area of dense forest increased in the decade(218 sq.km). This may be due to the efforts put by government and other organizations who are working for the regeneration of the natural forests of Garo hills. This increase is found mostly in the areas under moderate and high slope areas. Loss of open forest areas is found in all the slope categories where maximum loss found in low slope category. Similar trend is followed by non-forest areas. The high slope areas are also utilized for shifting cultivation which is vulnerable in terms of sheet erosion. In fact the areas under shifting cultivation in the high slope areas increased during the decade in considerable proportion (
5. Discussions
Based on Landsat TM (2001) and Landsat ETM+ (2010) data fourbroad types of land use/ cover were observed for the two different years in Garo hills. Classifications of these satellite imagery show that dense forest is confined mostly to the inaccessible area whereas other three types fall mainly in the moderate and low slope and elevation. The primary forest of the districts have been destroyed to a great extent by age old tradition of shifting agriculture which is extensively practiced in the hilly regions of the northeast India (Ramakrishnan, 1992;Yadavet al., 2012). This activity has led to the development of a variety of successional plant communities ranging from open forest to recently abandoned shifting cultivation fields (Prabhu, 2004). In the present study, the proportion of open forestand nonforests increased with the decrease in slope. These areas represent a mosaic of degraded landscape owing to the gentle slope of the area. This finding is similar to that of Susana & Mario (2000) who reported that deforestation may be widespread in areas where slopes are relatively gentle. There is general trend for mountain ecology that with increasing altitude there exists good ecological conditions (Hamilton et al. 1999). This criterion is fulfilling in the present study. The findings of the present research reflect the similar results of Ramesh et al. (1997) who stressed that deforestation process characterized by removal of the smallest and most accessible forest patches, followed by other developmental and livelihood activities. The present study is supported by Sarma and Barik (2010) who revealed that even vulnerable slopes are not spared from shifting cultivation consequences of which could be devastating. Semwalet al. (2004) revealed that deforestation may be widespread in an area where slope is relatively mild in nature. Balaguruet al. (2003) established while relating vegetation with slope angles of Shervayan hills of Eastern Ghats that number of species increases with increasing degree of slopes. Their finding is very much supportive to the present research. Whereas, Smith et al. (2005) while studying relationships between geomorphology and tree density revealed all type of trees in all slope categories but density was high in the stable landforms despite slope variations.
6. VI.
7. Conclusions
Garo hills districts support animpressive forest cover which is mainly concentrated in inaccessible areas and theseshould be conserved for biodiversity. It was observed in this study that the remote forest areas are also slowly encroached by the local people for shifting cultivation, mining and other activities. The districts have witnessed the conversion of forests to other non-forest areas during the last decade. This alteration needs to be checked immediately. After shifting cultivation the fallowland should be allowed to regenerate at least 15-20 years before another cycle. The short cycle not only effects soil fertility but also exposes the top soil for erosion. Further, the conversion of forest areas into other land use should be be undertaken to prevent the area from further deterioration is to educate the people and make them aware of the consequences of the effect of deforestation, mining and shifting cultivation.Landscape dynamics study is important to understand and assess the changes in natural resources due to various natural and anthropogenic reasons. The findings of the present study could be useful for management authority for making strategies for management of natural resources and monitoring its changes in due course of time. Temporal remote sensing data with detailed field observation could be an authentic tool for studying the landscape dynamics in any part of the globe which are environmentally fragile.
8. Global Journal of Human Social Science

| study | ||
| Path & Row | Data Type | Date Production |
| 138& 42 | Landsat TM | 15-12-2001 |
| 137& 42 | Landsat TM | 21-11-2001 |
| 137& 43 | Landsat TM | 26-12-2001 |
| 138 &42 | Landsat ETM+ | 06-02-2010 |
| 137 &42 | Landsat ETM+ | 30-01-2010 |
| 137 &42 | Landsat ETM+ | 30-01-2010 |
| 137 &42 | LiDAR STRM | 2001 |
| (DEMs) |
| classification | |||
| Year | Overall classification accuracy | Overall kappa statistics | D D D D ) |
| 2001 | 85.94% | 0.77 | ( |
| 2010 | 92.19% | 0.85 |
| Data acquirement | Collection of field data | ||
| DEMs data (LIDAR) | Landsat TM for 2001and ETM+ for 2010/ geo-referenced | Collection of GCPs of different Lu/Lc classes | Identification of drivers of deforestation |
| Layer stacking | |||
| Subset of the | Current jhum in | ||
| Subset of the study | study Area | different slope and | |
| Area | elevation | ||
| Supervised | |||
| classification | |||
| Slope and elevation | Land use/ cover map for 2001 and 2010 | Field verifications of different Lu/Lc classes | |
| Change matrix with respect to | |||
| slope and elevation | Results | ||
| during 2001 and 2010 | |||
| Land | Slope Year 2001 | Slope Year 2010 | ||||||
| use/cover class | Area in km 2 in low | Area in km 2 in moderate | Area in km 2 in high | Total | Area in km 2 in low | Area in km 2 in moderate | Area in km 2 in high | Total |
| Dense forest | 35 | 162 | 178 | 375 | 18 | 247 | 328 | 593 |
| Open forest | 1,697 | 3,403 | 1,265 | 6,365 | 897 | 2,576 | 834 | 4,307 |
| Current jhum | 67 | 86 | 19 | 172 | 107 | 268 | 46 | 421 |
| Non-forest | 913 | 306 | 36 | 1,255 | 1,690 | 866 | 290 | 2,846 |
| Total | 2,712 | 3,957 | 1,498 | 8,167 | 2,712 | 3,957 | 1,498 | 8,167 |
| Land | Elevation Year 2001 | Elevation Year 2010 | ||||||
| use/cover class | Area in km 2 in low | Area in km 2 in moderate | Area in km 2 in high | Total | Area in km 2 in low | Area in km 2 in moderate | Area in km 2 in high | Total |
| Dense Forest | 88 | 163 | 124 | 375 | 98 | 365 | 130 | 593 |
| Open Forest | 4,146 | 2,197 | 22 | 6,365 | 2,534 | 1,762 | 11 | 4,307 |
| Current Jhum | 107 | 48 | 17 | 172 | 174 | 209 | 38 | 421 |
| Non-Forest | 1,040 | 173 | 42 | 1,255 | 2,575 | 245 | 26 | 2,846 |
| Total | 5,381 | 2,581 | 205 | 8,167 | 5,381 | 2,581 | 205 | 8,167 |
| Area in | Area | Area in | Area in | Area in | Area | ||
| km 2 | in % | km 2 | % | km 2 | in % | ||
| Dense to open forest | 43 | 1.59 | 34 | 0.86 | 43 | 2.87 | 120 |
| Open forest to dense forest | 22 | 0.81 | 124 | 3.13 | 139 | 9.28 | 285 |
| Open forest to current jhum | 90 | 3.32 | 208 | 5.26 | 65 | 4.34 | 363 |
| Open forest to non-forest | 902 | 33.26 | 746 | 18.85 | 195 | 13.02 | 1,843 |
| Current jhum to open forest | 14 | 0.52 | 152 | 3.84 | 13 | 0.87 | 179 |
| Non-forest to open forest | 67 | 2.475 | 217 | 5.48 | 22 | 1.47 | 306 |
| No changes | 1,519 | 56.01 | 2,400 | 60.65 | 1,003 | 66.96 | 4,922 |
| Others | 55 | 2.03 | 76 | 1.92 | 18 | 1.20 | 149 |
| Total | 2712 | 100 | 3,957 | 100 | 1,498 | 100 | 8,167 |
| Area in | Area | Area in | Area | Area in | Area | ||
| km 2 | in % | km 2 | in % | km 2 | in % | ||
| Dense to open forest | 14 | 0.26 | 97 | 3.76 | 9 | 4.39 | 120 |
| Open forest to dense forest | 87 | 1.62 | 183 | 7.09 | 15 | 7.32 | 285 |
| Open forest to current jhum | 154 | 2.86 | 191 | 7.40 | 18 | 8.78 | 363 |
| Open forest to non-forest | 1,637 | 30.42 | 195 | 7.56 | 11 | 5.37 | 1,843 |
| Current jhum to open forest | 108 | 2.00 | 64 | 2.48 | 7 | 3.41 | 179 |
| Non-forest to open forest | 275 | 5.12 | 26 | 1.00 | 5 | 2.44 | 306 |
| No changes | 2,996 | 55.68 | 1,791 | 69.39 | 135 | 65.85 | 4,922 |
| Others | 110 | 2.04 | 34 | 1.32 | 5 | 2.44 | 149 |
| Total | 5,381 | 100 | 2,581 | 100 | 205 | 100 | 8,167 |