1.
Figure1 represents a very simple working day. Solid lines represent the path of all obligatory activities and dotted lines the prism or feasible regions of movement in periods for which there are no fixed activities. The worker is assumed to be effectively fixed at home until 7:30am to 8:00am where he can conveniently sleep and take breakfast. He must then take a direct route to work, where he is obliged to stay until lunchtime. During the lunch hour he has a certain amount of freedom; he must be back in the office exactly an hour. From 2pm until about 5pm he is again expected to stay at work. But after 5pm he has no need to be home until 7pm for supper. In this period, 5-7pm, he can stay on at work or he can go somewhere near or stop off on the way back for a drink or visit. The main feature implicit in this model of daily behaviour is the idea that certain activities are fixed in both space and time.
2. II. Methodology a) Source of Data
The Activity Network Approach (ANA) was adopted for this study. ANA is a micro-behavioural, inductive approach that makes 'predictions about the whole from disaggregate data of the behaviour of individuals using Time Budget Diary (TBD). TBD questionnaire focuses on the socio-economic attributes of the individual, types of activities, location of activities, beginning and end time of activities, number of participants in each activity, extent to which each activity was arranged and whether an individual could have done:
? anything else at the time of this activity, ? this activity at any other time, ? this activity elsewhere, and whether, ? been anywhere else at the time of his activity is taking place.
3. b) Sampling Procedure
The 20 electoral wards in Ilorin formed the spatial framework for primary data collection. The use of these wards was based on the fact that it makes it easier to obtain data on population. The sample size was 500 literate individuals. This number was proportionally distributed among the 20 wards based on their 1991 population projected to 2006, using 3.5 percent annual growth rate. Number of respondents to be interviewed from each ward was randomly selected. This sample is considered adequate for the study of this
4. I. Introduction
Abstract -The paper analyses Spatial nature of activities of the people in Ilorin especially the length of time spent on each activity. Data were collected from 500 residents of Ilorin, each of whom completed a time budget diary over one week. Descriptive statistics wereused to summarize the data while stepwise regression analysis was used to determine the factors responsible for the spatial fixity of respondents' activities. The result shows that the activities were fixed in time and three variables: age, income and occupation were the major determinants of the time spent on the activities. The study also shows clearly that the temporal structure of activity in Ilorin is different from what obtains in Western cities where there is flexibility in the usage of time.
5. Year
6. 2012
Year nature because of the complexity of completing the questionnaire, the time and cost involved in administering the questionnaire, monitoring the respondents, and more importantly, because researches involving Time Budget Diary do not normally accommodate large samples (Timmermanns, 2000; Kwan, 2005). Each respondent was issued seven copies of the TBD questionnaire, one for each day of the week. Research assistants monitored the respondents at home and work places.
7. c) Method of Data analysis
The following methods were use to analyse the data: (i) descriptive statistics and tables to summarise the data; (ii) Stepwise regression analysis to determine the temporal fixity of the respondents.
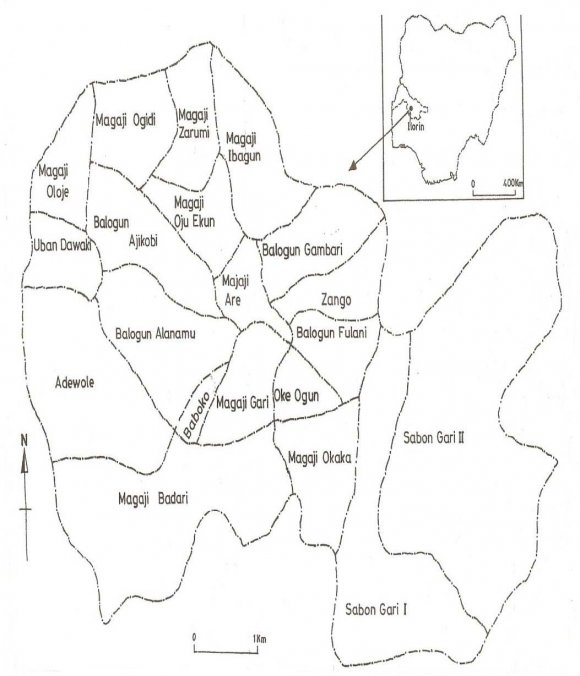
8. III. The Study Area
When the present city of Ilorin was founded is not very clear. Indeed, little is known about its pre-jihad political development. Ilorin is today the capital of Kwara State. It is located on latitude 80.30N and Longitude 40.35'E. It lies on the southern fringes of the savanna region and north of the forest zone. Ilorin is located in the Guinea savanna grassland belt of middle belt region of Nigeria. The main river in Ilorin is the Asa which flows in the south-north direction. It divides Ilorin into two parts: a western part representing the core or indigenous area and the eastern part where the Government Reservation Area (GRA) is located. (Oloru, 1998) Ilorin has experienced a rapid growth in its population over the years.
9. IV. Temporal Fixity of Activities
To establish the temporal nature (fixity) of activities, respondents were asked whether they could have done anything else at the time they did a particular activity. The number of respondents that answered this question was 296. The result shows that 280 (94.6%) respondents said they could not do anything else at the time Table 1 : Temporal fixity and activity location. a) Gender, marital status and activity fixity Among the males, 5.4 per cent could do something else at the time while 94.6 percent indicated that they could not do anything else at the time they were engaged in a particular activity. Among the were females none could do something else at the time they engaged in a particular activity, 47.0 percent had their activity fixed in time.
Among the married respondents 4.1percent can do something else at a time and 45.6 percent had their activities fixed in time. Among the singles, 1.4 percent could do something else and 49.0 percent had their activities fixed in time. 2 shows that s 4.1 percent Christians and 1.4 percent Muslims could have done something else at the time, while 47.3 percent each among Christians and Muslims respectively could not trade off the times they were performing their activities. Among people of different age groups, 1.5 Percent, 3.1 percent and 6.2 percent of the respondents between ages 18-30 years, 31-45 years and 46-60 years respectively could do something else at the period they were performing activities, while 51.4%, 39.0% and 3.5% among the 3 respective age groups had their activities fixed in time. 3, activity fixity varies among respondents with different qualifications. Among respondents with primary education, NCE and other qualifications, they all had their activities fixed in time with 1.4%, 23.6% and 1.4% respondents having their activities fixed in time. Among secondary, polytechnic and university degree holders 1.4%, 0.7% and 3.4% respondents can trade off their activity times while among the same group, 32.1%, 12.5% and 29.1% had their activity fixed in time.
10. d) Occupation type and Activity Fixity
Temporal fixity of activity also varies among people with different occupations. Among the artisans/technicians, students and those with other occupations, their activities were fixed in time with 28 (9.6%), 60 (20.6%) and 3 (1.0%) respondents who could not do anything else at the time of performing their activities. Among civil servants, traders and professionals, 3.4%, 1.4% and 0.7% respectively could do some other things else at the time of their normal activities. On the other hand 39.5%, 16.8% and 6.9% among the same group had their activities fixed in time, as shown in There is also a difference between the nature of activity (i.e. whether an activity is arranged, planned, routine or unplanned) and its temporal fixity. From Table 6; it is evident that the nature of activity determines its time fixity. For instance, respondent could not perform "arranged" and "planned" activities at any other time. The entire 9.5% and 1.4% arranged and planned activities could not be done at any other time. While in case of routine activities only 5.4% out of 296 respondents could have done their routine activities at any other time; and the remaining 83.8% had their activities fixed in time.
11. f) Location of Activity and Activity Fixity
Finally, temporal fixity of activity also varies with the type of activity, i.e. where the activity is based. In Table 7, 288 (97.3) of the respondents concerned could not have done anything else at that time i.e. they had their activity fixed in time. This comprises 47.6% who were engaged in home based activities, 51.7% who were engaged in office/work place-based activities, and 0.7% who were engaged in outdoor activities. Only 8.0% respondents did not have their activities fixed in time, these were 6.0% and 2.0% who were engaged in home based and office/work place-based activities. The temporal fixity of activities was further established when it was asked if these activities could be done at some other time. From Table 8, it is evident that only 8.5% of the respondent do not have their activity fixed in time. This include 7.4%, 0.7% in office/work place activities. On the other hand 91.5% of the respondents could not have done their activities at some other time. This includes 40.0% who are engaged in home based activities, 51.0% in office/work place activity and 0.7% in outdoor activities. Temporal fixity of activity varies with different occupational groups as presented in the Table 9 which shows that the majority of the respondent (82.48%) could not have done their activities at some other time. This consisted of 35.73% civil servants, 15.46% traders/businessmen, 8.29% artisans, 4.46% professionals and 17.52% students. The few (17.52%) who could have done their activities at some other time consisted of people in different occupations as well.
The result of this analysis is related to the one obtained for the earlier question that is, could you have done anything else at that time? (Table 4) where 16 respondents (5.4%) answered in the affirmative and 280 (94.4%) said they cannot. All these go to establish that most of the activities are fixed in time and space. From the analysis above, the temporal nature of the activities of the respondents is mainly routine. That is, they perform the same type of activities everyday and these activities are fixed in time irrespective of the socioeconomic status of respondent and activity type. Since the activities of the respondents were fixed in time and space, there was a generalized pattern in the sequencing of these activities. The fixity in time of the respondents activity is determined by a number of factors. These factors were analyzed by using the stepwise multiple regression analysis. The result of the stepwise regression is presented in Table 10 Table 10 : Stepwise regression analysis for determinants of temporal fixity of activities. The result of the stepwise regression in Table 10 shows that only three steps are possible. The criterion for selecting variables in the analysis is set at 0.05 level of significance. The result shows that age estimated annual income and occupation of respondents are significant. The level of significance is as high as 0.001. This implies that apart from age, annual income and occupation, all other variables are not significant in explaining time devoted to activities; although this variables differ vary from day 1 to 7.
The age factor is significant in the sense that all the sampled respondents fall within the age group of economically viable or productive segment of the population (i.e. between the age brackets of 18 years to 60 years) in all gender, qualification and occupational groups. On the other hand, annual income as a factor significant in explaining time devoted to activities is due to the fact that majority of the respondents belong to low income group, hence they have to work from morning till evening to make ends meet while those in public service engage in multiple occupations. Finally, occupation as a significant factor explains one of the characteristics of third world cities where people engaged in mostly informal sector and self -owned occupations hence they can afford to spend longer time. (Adedokun, 2012, Adedokun andAjayi, 2012) Based on the above findings in the study area, we would like to construct a generalized model of land use planning and facility location in a traditional medium size urban center using Ilorin as a case study. (Fig. 2)
12. 2012
Year behaviour of the people. Instead of strict land use zonation approach, facilities may be located closely to or around neighborhoods where people are fixed to. In this case and as demonstrated, facilities and infrastructures should be located between homes and work places. Obviously, if there is a demonstrable linkage between two activities in space, it makes sense to locate the facilities housing them in the same space so as to eliminate time and energy consuming travel. (Adedokun, 2008(Adedokun, , 2009(Adedokun, , 2011) )

| Could | you | Gender | Marital Status | ||||||||||
| have | done | Male % | Female % | Total | % | Married | % | Single | Total | % | |||
| anything else | |||||||||||||
| at the time | |||||||||||||
| Yes | 16 | 5.4 | _ | 16 | 5.4 | 12 | 4.1 | 4 | 1.4 | 16 | 5.4 | ||
| No | 141 | 47.6 | 139 | 47.0 | 280 | 94.6 | 135 | 45.6 | 145 | 49.0 | 280 | 94.6 | |
| Total | 157 | 53.0 | 139 | 47.0 | 100 | 100.0 | 147 | 49.7 | 149 | 50.3 | 296 | 100.0 | |
| Source : Field work, 2005. | |||||||||||||
| b) Religion, Age and Activity Fixity | |||||||||||||
| Among people of different religious and age | |||||||||||||
| groups, temporal fixity of activity varies. Table | |||||||||||||
| Activity type | Could you have done anything else at this time? | |||||
| Yes | % | No | % | Total | % | |
| Home based | 14 | 4.72 | 112 | 37.8 | 126 | 42.57 |
| Office/work place | 2 | 0.68 | 166 | 56.08 | 168 | 56.76 |
| Outdoor | _ | _ | 2 | 0.69 | 2 | 0.69 |
| Total | 16 | 7.43 | 280 | 91.9 | 296 | 100 |
| Could you | EDUCATION QUALIFICATION |
| have done | |
| anything | |
| else at the | |
| time |
| Could you | OCCUPATION |
| have done | |
| anything | |
| else at the | |
| time |
| Nature of Activity | Could you have done anything else at the time | Total | % | |||
| Yes | % | No | % | |||
| Arranged | _ | _ | 28 | 9.5 | 28 | 9.5 |
| Planned | _ | _ | 04 | 1.4 | 4 | 1.4 |
| Routine | 16 | 5.4 | 248 | 83.8 | 264 | 89.2 |
| Total | 16 | 5.4 | 280 | 94.6 | 296 | 100 |
| Activity Location | Could you have done anything else at that time | |||||
| Yes | % | No | % | Total | % | |
| Home based | 6 | 2.02 | 135 | 45.6 | 141 | 47.6 |
| Office/work place | 2 | 0.7 | 151 | 51.0 | 153 | 51.7 |
| Outdoor | _ | _ | 2 | 0.7 | 2 | 0.7 |
| Total | 8 | 2.7 | 288 | 97.3 | 296 | 100 |
| Source : Field work, 2005. | ||||||
| Activity Location | Could you have done this at some other time? | |||||
| Yes | % | No | % | Total | % | |
| Home based | 21 | 7.4 | 119 | 40.20 | 141 | 47.64 |
| Office/work place | 1 | 0.4 | 153 | 51.7 | 153 | 51.7 |
| Outdoor | 2 | 0.7 | 2 | 0.7 | ||
| Total | 24 | 8.5 | 272 | 91.5 | 296 | 100 |
| Source : Field work, 2005. | ||||||
| Could you | Occupation | |||||||||||||
| have done | Civil | Trading | Artisan | Professional | Students | Others | Total | |||||||
| this | at | Servants | Buss. | Technical | ||||||||||
| some | ||||||||||||||
| other time | ||||||||||||||
| Yes | 21 | 7.21 | 8 | 2.74 | 4 | 1.37 | 9 | 3.0 | 9 | 3.0 | 51 | 17.52 | ||
| No | 104 | 55.7 | 45 | 15.46 24 | 8.27 | 13 | 3.46 51 | 17.2 3 | 0.10 240 82.48 | |||||
| 3 | ||||||||||||||
| Total | 125 | 42.9 | 53 | 18.21 28 | 9.62 | 22 | 7.56 60 | 20.6 | 3 | 0.10 291 100 | ||||
| 5 | 1 | |||||||||||||