1.
Methodology : During the study, transect and fixed point measurements were taken hourly and averaged over a month. All temperature difference was calculated as site temperature minus reference temperature. Thus, a negative (-) temperature difference indicates that the site was cooler than the reference station. The reference station is the rural environment.
Results : Dry season months showed strong variability in temperature. The downtown site was the warmest (2.0 0c) during the day. The heavily vegetated urban residential site (LVR) and suburban site (LOR) with fully developed vegetation canopy were the coolest (-3.8 and -2.68).Nighttime temperature showed a clear downtown-centered heat island of up to 2.30c warmer. All residential sites were warmer than the reference site by 0.4 to 2.1 0c. The highest nighttime intraurban air temperature difference was observed during the early evening periods 1500hrs to 23oohrs. This leads to a maximum nighttime air temperature heat island of about 2.30c during the study period.
2. Conclusion : The diurnal march of the urban heat island of
Enugu is revealed to have a close link to the diurnal cycle of human activities as well as the meteorology characterizing daytime and nighttime conditions. The study recommended the use of extensive green cover, light-colored materials for roofing and pavements and compact designed cities.
3. I. Introduction
rbanization is a defining phenomenon of this century. Developing countries are at the focus of this transformation, as highlighted in the World Bank's 2009 urban strategy. It is often repeated that more than half of the world's population is now urban. Most of the population of both industrialized countries is urban (UN, 2010). Many developing countries in other regions of the world are following the same path. This transformation represents a challenge. Urban heat island is one of those challenges. The city of Enugu has witnessed remarkable growth in its urbanization in recent years and its population during the past few decades has more than tripled. The higher temperature in urban areas than the surrounding rural areas is described as the urban heat island effect (Oke and Maxwell, 1975). UHI is also referred to as the increase of air temperature in the near-surface layer of the atmosphere within cities relative to their surrounding countryside (Voogt, 2002).
Based on numerical simulation, Taha (1997) found that the UHI is a result of the changes in surface albedo and vegetation cover owing to urbanization. As controlled by different assemblages of energy exchange processes, the characteristics of UHl can vary from place to place and from time to time (Arnfield, 2003). Modification of air temperature by urban areas at roof level has been reported extensively in mid-latitude cities (Chandler, 1962;Oke, 1982), but it has however been noted that transferability of results from knowledge regarding the mid-latitude studies is still limited (Oke et al, 1990(Oke et al, , 1991)). Consequently, it becomes necessary to undertake a first hand analysis of urban heat island characteristics of our cities. Again, few studies have attempted to describe the seasonal behavior of the heat island during an annual cycle. Filling these identified gaps forms the objective of this study. As such, the study intends to analyze the characteristics of UHI in Enugu urban during dry season period. This idea is born of the fact that the essence of studies of the UHI is not only predicated on the necessity to gain knowledge of its numerous secondary effects when excessive, but also its practical needs in town planning and creation of optimum bioclimatic conditions (Rosefeld, 1995, Balogun, et al, 2010).
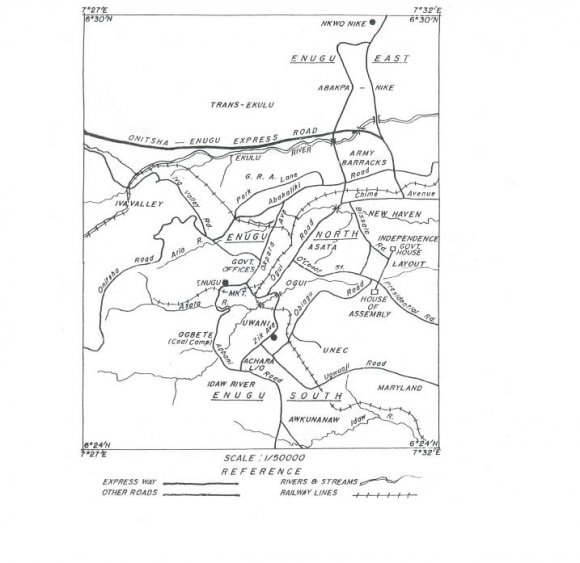
Although, it is not uncommon to refer to UHI as a noctural phenomenon (Gdaelman et al, 2003;Bonacquisti, 2006) because of the lower UHI intensity in daytime (Alonso et al, 2003), there were studies focusing on daytime UHI (Giridharan et al, 2004;Hidalgo et al, 2009). Enugu Urban which is the study area is made up of Enugu East, Enugu North, and Enugu South (figure 1.2). Enugu Urban is also located within latitude 6.24 0 N and 6.30 0 N and longitude 7.27 0 E and 7.32 0 E. It is an hour's drive from Onitsha, one of the biggest commercial cities in Africa and 2 hours drive from Aba, another very large commercial city, both of which are trading centers in Nigeria. Enugu Urban shares boundary with Igbo Etiti and Isi-Uzo Local Governments in the north, Udi local Governments in the west, Nkanu West Local Government in the south and part of Nkanu East Local Government Area in the east. There are 18 prominent residential areas in the Urban. These are Abakpa, Trans-Ekulu, Nike, GRA, Ogui, Asata, New Heaven, Obiagu, Ogbete, Iva valley, Independence Layout, Achara Layout, Ugwuaji, Maryland, Awkanaw, Uwani, Agbani, and Coal Camp. Enugu Urban is the most developed urban area in Enugu state.
4. II. Study Area
The study area falls within the humid tropical rain forest belt of Southeastern Nigeria. It has two seasons, the raining season and the dry season. The rainy season which is characterized by heavy thunderstorms lasts from April to October with the South Westerly moisture accompanied by air mass moving northwards into the city. The turbulent runoff result in leaching, sheet erosion and eventually gullies (Akabuike, 1990). The mean temperature varies from about 20.30ºC to about 32.16ºC in the dry season and rainy season respectively, (Akabuike, 1990). During the dry season the humidity is lower than in the rainy season. Temperature is most often high during the day and low during the night. This results in high evaporation rate during the day. Harmatten which occurs between the months of November and February is always accompanied by poor visibility mostly at night and early in the morning.
The rivers and streams which flow from the Udi hills dissect the study area into several sections.
5. III. Methodology
Data collection spanned over two seasons (2006 to 2007). The essence was to capture the peak periods, frequency, magnitude and seasonality of urban heat variations in places. The months of Feb-Mar were selected because of high temperature during this period. Temperature data were collected during the day and night. The following land use/land cover sites were selected for data collection. a. High-density, high-rise, non-residential areas with no greenery (DTL). b. High density, high-rise, residential areas with low greenery (HDR). c. Medium density, mixed residential (some residential, some commercial/ institutional area with a greenery extent between DTL and HDR. d. Areas with similar land-use, building density and greenery one having more fully developed vegetation canopy than the other (LVR and LOR) During the study period, transect and fixed point measurements were taken hourly and averaged over a month. All temperature differences were calculated as site temperatures reference temperature, thus a negative (-) temperature deference indicates that the site was cooler than the reference station; and positive (+) indicated the site was warmer than the reference station. The magnitude of microclimate variations in urban areas depended on the atmospheric conditions at the macro-level. Since simultaneous measurement at all the30 sites were not made, it was necessary to classify the measurement period according to atmospheric conditions so that data from different sites could be compared.
Wind speeds and cloud-cover amounts are closely related to the timing and the magnitude of urban heat island (Landsberg, 1981). Among other things, these two parameters also influence atmospheric stability. Fine sunny days with little wind usually lead to unstable surface atmospheric conditions. Stable atmospheric conditions are generally associated with clear, calm nights while cloudy and windy days tend to produce neutral atmospheric conditions (Oke, 1987). Therefore, data on atmospheric stability near ground can be used to estimate the combined effects of wind speed and cloud cover on the development, timing and the magnitude of urban heat island.
Although many methods of estimating atmospheric stability near the ground exist, Pasquil-Turner Index modified by Karlson (1986) is the most relevant for the present study since it utilizes solar radiation and wind speed data only. Solar radiation being heavily influenced by cloud cover, the modified Pasquil-Turner (MPT) index provides the best estimate of the combined influence of cloud cover and wind on intra-urban micro-climate differences. Karlson's MPT is given by the following equation: MPT= Q*/ (U) 2 Where Q* = hourly average net radiation at 1.5m above ground (Wm -2 ) U= hourly average wind at 7.4m above ground (Ms -1 )
The following MPT values were selected as cutoff points for the three atmospheric stability conditions examined in the present study: The downtown site was the warmest (2.0 o c). The heavily vegetated urban residential sites (LVR) and suburban sites (LOR) with fully developed vegetation canopy were the coolest (-3.8 and -2.68) respectively. The hour-to-hour variation in air temperature during day time was significant. Also, it was observed that the magnitude of the temperature differences decrease as background climate become hotter. During the day very few cool islands were observed. The thick vegetated areas of GRA (Bent Lane) recorded few days of urban cool islands. The extensive tree canopy of GRA and the urban plantation along WAEC road (adjacent Okpara Square) produced cooling during the day. The peak temperature value was recorded between 1300hrs and 1500hrs.
6. b) Dry season (Nighttime)
Unlike the daytime (dry season), nighttime temperature showed a clear downtown -centered heat island. Table 2 clearly depicts this variation. All residential sites were warmer than the reference site (by 0.4 to 2.1 o c) while the downtown location was up to 2.3 o c warmer. This leads to a maximum nighttime air temperature heat island of about 2.3 oc during the study period. The highest nighttime intra-urban air temperature difference was observed during the early evening period (15hrs to 2300hrs).
7. V. Discussion
The result showed that the downtown location was warmer than other residential sites both at night and in the day. The condition was the same both in stable and unstable atmospheric conditions during the dry season. Strong urban heat island develops preferentially on calm dry season days. It also showed that urban heat island in Enugu has a close link to the diurnal cycle of human activities as well as the meteorology characterizing day and night conditions. Extensive tree
8. VI. Recommendation
The study, based on these findings, proposed some design strategies for the mitigation of Enugu urban heat island.
Most of these strategies are applicable to the downtown location. Employing these strategies will result in substantial green cover increase in the downtown locations while street level thermal comfort is enhanced by arcades and suitable building massing (compact designs).The building massing is such that tall buildings are on the eastern side of the city blocks while green area is in the center and to the northeastern side of the city. In most of the sampled areas, street tree planting offers the greatest cooling potential per unit area, followed by light surfaces. However, light surfaces offer the greatest absolute temperature reductions, because 23.02% of Enugu urban surface area could be lightened, whereas only 9.45% of the city's surface area could be planted with new street trees.
Planting street trees has greater cooling potential than planting open-surface/plantation trees, because the temperature differential between trees and impervious surfaces is greater than that between trees and grass. Also, the cooling effect of open-space trees tends to be localized. For example, surface cooling around judiciary quarters (Okpara square) tends to be limited to 61 meters from the square's borders. Again, mitigation strategies should be chosen to reflect neighborhood conditions. For example, in most casestudy areas, curbside planting is the individual strategy with the greatest cooling potential. However, in Achara Layout, Abakpa and New Heaven, with the greatest available rooftop, space, living roofs could have a greater impact. Finally, using light-colored materials for the roofing of downtown locations as well as improving the reflectivity of pavements within the urban centers and the adjoining suburbs could minimize the impact of urban heat islands in Enugu urban.
9. VII.
10. Conclusion
The dry season air temperature measurements over Enugu have been analyzed and results reveal some spatial and temporal characteristics of the urban heat island in Enugu. Some of the observed characteristics include: a. The downtown location (DTL) was warmer than other residential sites both at night and in the day. The condition was the same for both stable and unstable atmospheric conditions during dry season. b. Observation has also shown that although urban heat island exists over the city, thermal levels vary considerably within the city with a direct relationship to land use and vegetation coverage.
c. Extensive tree canopy produced some cooling during the day, but results in warm microclimate at night. Sites LVR (e.g. GRA) exemplify this pattern. d. Dry season months showed strong urban heat island develops preferentially on calm dry season days. e. Urban heat island during dry season peaks between 1500hrs and 2300hrs. f. The diurnal march of the urban heat island of Enugu urban is revealed to have a close link to the diurnal cycle of human activities as well as the meteorology characterizing daytime and night time conditions. g. The study recommended the use of extensive green cover, light-colored materials for roofing and pavements; and compact designs.

| LOCAL GOVERNMENT AREA | MALES | FEMALES | TOTAL |
| Enugu East | 131, 214 | 145, 905 | 277, 119 |
| Enugu North | 118, 895 | 123, 245 | 242, 050 |
| Enugu South | 93, 758 | 104, 274 | 198, 032 |
| Total | 343, 867 | 373, 424 | 717, 201 |
| Source : National Population Commission (2006). |
| Site | Location Name | Temperature |
| DTL | Ogui Road | +2.0 |
| LOR | Independence | -2.35 |
| L/O | ||
| LVR | GRA | -3.8 |
| NW2 | UNEC | -2.2 |
| HDR | Achara L/O | -0.45 |
| Site | Location Name | Temperature |
| DTL | Ogui Road | +2.3 |
| LOR | Independence | 0.4 |
| L/O | ||
| LVR | GRA | 1.1 |
| NW2 | UNEC | 0.8 |
| HDR | Achara L/O | 2.1 |