1. Introduction
olid waste management has been historically challenged to societies. Improperly managed waste can pose serious damages on human and environment. Changing in the patterns of production and consumption due to urbanization and economic growth resulted in an increased amount and diverse types of solid waste. Recycling, with its numerous benefits on reducing negative impacts from waste and conserving natural resources, has been lighten into attention. For example, recycling of an aluminum can saves up to 97% of the energy for producing new can from raw material; which is enough energy to keep a 100 watt light bulb burning for 4 hours, whereas every ton of paper recycled saves 17 trees (Letcher and Shiel, 1986;Martin, 2003;Sherlock, 2003).
2. II.
3. Literature Review
Once products are produced, the role of the household then becomes crucial. Household can make a number of decisions regarding what to do with the products they purchased and indeed if to purchase such products (Barr, 2002). Problem of municipal solid E-mail : [email protected] waste and the achievement of recycling program are therefore largely engaged in household decision making.
The literature on understanding and motivating people to recycle is marked by two major phases (Hornik, Cherian, Madansky, and Narayana, 1995). In the primary phase, spanning a period from 1970s to early 1980s, researches emphasized external incentive such as monetary rewards and punishments, and sought to the demographic characteristics. The studies generally found that recyclers reported monetary concerns as their primary incentives. This phase led to a spread view that external incentive alone can initiate and sustain recycling behaviors (Geller, Winett, and Everett, 1982). However, later research suggested that if the incentive were purely economic and external, the desired behavior would vanish when the incentive was withdraw (Pardini and Katzev, 1984) The second phase therefore emphasized on finding nonmonetary and lasting incentive to increasing recycling with more concerns on intrinsic motivation such as locus of control III.
4. The Theoritical Framework
Theory of reasoned action (TRA) and theory of planed behavior (TPB) have been well acquainted as models that provide framework to explain the determinants of behavior in social and psychological perspective. The TRA suggests that behavior is a direct function of intention which is formed by attitude toward that behavior and subjective norm. Attitude consists of beliefs about the consequences of performing the
5. A
6. Year
Nations worldwide have position recycling as one of the most sensible solutions both economically and ecologically for managing municipal solid waste. Unfortunately, though an intensive call for household recycling participation has been made, most of developing countries still experience low recycling rate. Since the achievement of recycling practice depends largely upon the active and sustained involvement of people. It is essential to investigate barriers impeding household recycling decision, and it is the main study of this paper. and personal satisfaction (De Young, 1986). In addition to the foregoing intrinsic and extrinsic motivation approached, two other factors that found to have an impact on recycling behavior are social pressure and perceived inconvenience of recycling. Social pressure to recycle can result from a concern of perception from family, neighbors, and friends. Conversely, lack of support, household may increase pressure not to recycle. The time, space, and trouble it takes to prepare, store, and transport materials may also dissuade even intrinsically motivated individuals who believe that recycling will have favorable environment result (Vining and Ebreo, 1990;Vining, Linn, and Burdge, 1992).
behavior multiplied by one's valuation of these consequences. Subjective norm is seen as a combination of perceived expectations from relevant individuals or the groups with intentions to comply with the expectations, namely it is one's perception that most people who are important to him think he should or should not perform the behavior in question. When one has high intention, it is likely that he or she will perform the behavior (Fishbein and Ajzen, 1975). The TPB is an extension of TRA proposed by Ajzen (1985) . In addition to the attitude and subjective norm, TPB adds the concept of perceived behavioral control (PBC) which is developed from self-efficacy theory originated by Bandura (1977) into the model to include non-volitional behavior or those requiring resources, opportunities, and specific skills. The PBC refers to the individual's possible beliefs of difficulty in completing a certain behavior and influences both intention and behavior. The TRA and TPB have been extensively applied to predict recycling behavior in many occasions (Boldero, 1995 ;Taylor and Todd, 1995;Cheung, Chan, and Wong, 1999;Chu and Chiu, 2003;Tonglet, Philips, and Bates, 2004, to name a few).
However, many researchers supported that there are other variables besides elements of TRA and TPB that predict environmental behaviors (Boldero,1995;Cheung, Chan and Wong ,1999;Barr, 2002;Chu and Chiu, 2003). Vining and Ebreo (1990) found a positive relationship between availability of monetary incentive and recycling behavior, where Goldsby (1998) found a negative effect of economic incentive on recycling involvement. Knowledge and information were also found to have positive impact on recycling behavior (Vining and Ebreo, 1990;Barr, 2002). In addition, convenience factors were argued to be a barrier to recycling action in many researches (Gamba and Oskamp, 1994;Tucker, 1999;Barr, 2002). With the aim to investigate promising constraints of household recycling participation, this study integrated relevant factors in accordance with previous studies and employed the TPB as the critical framework of the research.
IV.
7. Research Design a) Instrument development
This research selected Thailand as a case study to investigate the situation of household recycling behavior in urban developing countries. The data of this research were collected from personal interviews based on a structured questionnaire, designed follow the previous literatures. To examine the quality of the questionnaire items, pre-tests were carried out two times in November and October 2010 prior to the main survey which is conducted during the period of December 2010 to January 2011. Participants in the pre-tests were 80 Thai citizens who have been resided in Bangkok not less than 90 days. The internal consistency of question dimensions was measured by Conbach's alpha coefficient which indicates the degree to which a set of items measures a single unidimensional latent construct, values from 0 to 1. Values above 0.7 indicate a good internal consistency (Cronbach, 1951).
The results of the second pre-test were satisfied in every question with the alpha coefficients over 0.71. The verified questionnaire survey consisted with 3 parts; 1) questions regarding respondents' profile, 2) questions regarding recycling behavior and intention, and 3) six-point scales question items of promising explanatory factors (strongly disagree=1 to strongly agree=6). The definitions of technical terms using in the questionnaire were clarified to the respondents prior to the interview to avoid error answers from misunderstanding.
8. b) Sampling and data collection
The Bangkok capital city was selected for the study area. The target population was individuals who have been inhabited in Bangkok at least 90 days. Multistages sampling method was applied to gather research samples. Features of total fifty districts in Bangkok were firstly examined in the first step. As the research target is urban waste recycling, the inner-Bangkok area, which is classified as residential and business area (BMA data center, 2009), was selected as the interest group. Pathumwan district was randomly selected from 21 districts located in inner-Bangkok in the following stage by drawing lots. Next, the required sample size was calculated by using Krejcie and Morgen's formula (Krejcie and Morgan, 1970).
According to the population and housing statistic provided by Department of Provincial Administration (2009), Pathumwan district has a population (N) of 58,858 people (male 27,463; female 31,395) as of 2009. Based on the sampling formula, 381 samples were required at 5% margin error. In the final stage, required sample for 4 sub-districts in Pathumwan district was calculated by the ratio-sampling method. As total sample=381 for Pathumwan district based on 2009 data, 131 samples were required for Roungmuan subdistrict (N sub =20,031), 130 samples were required for Lumphinee sub-district (N sub =20,278), 70 samples were required for Wangmai sub-district (N sub =10,905), and 50 samples were required for Pathumwan sub-district (N sub =7,644).
V.
9. Data Analysis a) Descriptive analysis
Most of the respondents were female (56.7%), completed undergraduate school (63.3%), single (70.9%), living in a single house (55.9%), and having personal monthly income in a range of 10,001 to 20,000 Thai baht (41.7%). The median age of the respondents was 28
10. b) Principal component analysis
Principal component analysis (PCA) was carried out prior to the analysis to examine the empirical dimensions of questionnaire data measured on ordinal scales (Kaiser, 1974;Field, 2005). The result of principle component analysis of twenty-seven items showed no problematic collinearity across dimensions. KMO=0.73 showed a modest sampling adequacy of factor analysis. The Bartlett's test is highly significant at p-value equal to .00, approved that the PCA is applicable. The factor loadings demonstrated 6 dimensions. All components in aggregate explained 92.76% of the total variance in the overall data.
11. c) Logistic regression analysis
Logistic regression analysis was employed to examine the significant impacts of variables. To test whether the factors present direct effects on recycling behavior or indirect effects via recycling intention, explanatory variables in the study were estimated in two stages; the first stage with recycling intention as the dependent variable, the second stage with recycling behavior as the dependent variable. Both intention to recycle and recycling behavior were measured by selfreport binary scale treated as dummy variables coded as 1 = yes and 0 = no.
A two-step hierarchical logistic regression analysis was applied in the first stage. The sociodemographic variables which are classified as the factors at the lowest level were firstly entered. The seven variables together provided a model that correctly classified 64% of the sample (82.3% of sample with intention to recycle; 36% of sample with no intention to recycle). Hosmer and Lemeshow test was significant demonstrated that the model with only demographic variables did not adjust well to the data. Entering the ten variables on the next step amplified the percentage of respondents correctly classified to 90% (92.2% of sample with intention to recycle; 86.7% of sample with no intention). Hosmer and Lemeshow test become insignificant. Omnibus test of model coefficients was significant showed that inclusion of the second-step variables improved the model. Nagelkerke R 2 improved from .116 to .738. The value of -2log -likelihood also decreased from 476.680 to 210.823 presented more accurate the predictions of the model. The attitude toward recycling, external subjective norm, awareness of recycling benefit, perceived facility condition, and perceived recycling skill were significant predictors of recycling intention.
In the second stage, a three-step hierarchical logistic regression analysis was employed to measure the predictors of actual recycling behavior. The sociodemographic variables entered on the first step provided a model that correctly classified 63.3% of the sample (74.2% of recycler; 48.8% of non-recycler). Hosmer and Lemeshow test was still significant. Entering psychological, situational, and economic variables on the second step increased the percentage of respondents correctly classified to 89% (90.3% of recycler; 87.2% of non-recycler). Hosmer and Lemeshow test became insignificant. Omnibus test of model coefficients showed a significant contribution of the entered variables. Nagelkerke R 2 increased from .141 to .731. The value of -2log-likelihood decreased from 478.459 to 221.105. All goodness-of-fit indicators demonstrated a more accuracy of the model. The resident year, perceived facility condition, perceived personal recycling skill, and perception of having adequacy recycling information significantly predicted recycling behavior in this level. The entry of the recycling intention variable on the last step improved the model substantially. The percentage of respondents correctly classified increased to 94.5% (96.3% of recycler; 92.1% of non-recycler). Hosmer and Lemeshow test was not significant. Omnibus test of model coefficients at step and model level were both significant. Nagelkerke R 2 improved to .878. The value of -2log-likelihood decreased to 116.357. The resident year, perceived facility condition, perceived personal recycling skill, perception of having adequacy of recycling information, and recycling intention significantly predicted recycling behavior. The significant impact of resident year, which in part reflected degrees of expertise in the facilities and services in the community, supported that a better understanding in the recycling system tended to positively affect recycling involvement of people. Summary of results demonstrated in table 1 and 2, where Exp( ) = Exponent of and statistically significant at the *0.05 and **0.01 level.
12. VI.
13. Discussion and Conclusion
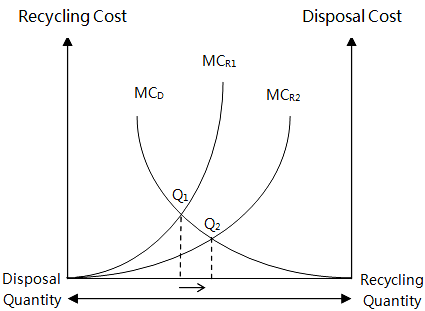
The results of analysis show that key factors that influence final decision of household whether to recycle or not recycle are all regarding to costs of recycling; both economic (e.g., monetary transaction cost) and non-economic cost (e.g., opportunity cost or effort). If people have less skill, less information, and find it difficult to get access to recycling facility, they are likely to decline to get involved. The figure. Other things being constant, a rise in the variable costs of recycling lead to an upward shift of MC R , results in a lower quantity of recycling and an increase in amount of disposal.
14. Year
Given there are two choices of waste treatment for household; recycling or disposal, and consider lack of facility, lack of skill, and inadequacy of recycling information as variable costs of recycling. MC R represents marginal cost of recycling. MC D represents marginal cost of disposal and all social costs are assumed to be included in the marginal cost of disposal. According to Tietenberg (2006), efficient amount of recycling will be attained at the MC D =MC R .
Additionally in the developing countries with ineffective garbage system, MC D is lower, which further cause lower recycling rate. Consequently, intensive attentions should be paid on lack of fundamental services, facilities, and information. Household should be educated how to recycle in practice, which could be executed by conducting workshops or seminars. These altogether could reduce cost of recycling (shift MC R1 to MC R2 ) and thus enlarge the recycling involvement of household (from Q 1 to Q 2 ). This study also has some limitations. First, the behavior concerned in this study was self-reported so the respondents might be selfaware or have bias on reporting their recycling behavior. Alternative methods, such as a diary report, might be combined to resolve this limitation in the future study. In addition, the current survey covered only one geographical area. Future research might enlarge study areas and additionally investigate the identifiable recycling behavior of population with different life styles and cultures.

| 2 34 |
| Volume XII Issue W XII Version I |
| D D D D ) A |
| ( |
| Global Journal of Human Social Science |
| 2 36 | |||||
| Volume XII Issue W XII Version I D D D D ) A | Predictors | Step1 | Exp( ) | Step2 | Exp( ) |
| Global Journal of Human Social Science ( | Gender Single Married Divorce House type Income less than 10000 Thai baht Income 10001-20000 Thai baht Income 20001-30000 That baht Income 30001-40000 Thai baht Income 40001-50000 Thai baht Income more than 50000 Thai baht Junior high school or lower High school Undergraduate Graduate or higher Age Resident year Attitude toward recycling | -.437 .129 -1.080 -.272 -.324 -.401 -1.104 -.417 -.219 -.863 -.700 -1.165 .028 .040* | .646 1.137 .340 .762 .723 .669 .332 .659 .803 .422 .497 .312 1.028 1.041 | .089 1.214 -.839 -.831 -.899 .122 -.552 -1.560 .607 -1.531 -1.825 -1.176 -.028 .013 1.109** | 3.366 .432 .436 .407 1.130 .576 .210 1.835 .216 .161 .309 .972 1.014 3.032 1.094 |
| Internal subjective Norm | -.117 | .889 | |||
| External subjective Norm | .496* | 1.642 | |||
| Awareness of recycling benefit | .465* | 1.592 | |||
| Economic incentive | -.151 | .860 | |||
| ed | -.188 | .829 | |||
| Perceived time needed for recycling | .141 | 1.151 | |||
| Perceived facility condition | 1.777** | 5.910 | |||
| Perceived recycling skill | 1.324** | 3.758 |
| Predictors | Step1 | Exp( ) | Step2 | Exp( ) | Step3 | Exp( ) | |
| Gender | -.412 | .662 | .370 | 1.448 | .562 | 1.755 | |
| Single | |||||||
| Married | -.034 | .966 | 1.076 | 2.932 | .313 | 1.367 | |
| Divorce | -1.054 | .349 | -.662 | .516 | -.230 | .794 | |
| House type | -.302 | .739 | -.293 | .746 | .027 | 1.027 | |
| Income less than 10000 baht | |||||||
| Income 10001-20000 baht | -.115 | .891 | -.266 | .766 | .819 | 2.268 | |
| Income 20001-30000 baht | -.222 | .801 | .762 | 2.142 | 1.461 | 4.312 | |
| Income 30001-40000 baht Income 40001-50000 baht | -.763 -.001 | .466 .999 | .805 -.519 | 2.236 .595 | 2.383 1.319 | 10.832 3.738 | Year |
| Income more than 50000 baht | .169 | 1.184 | 1.482 | 4.402 | 1.743 | 5.713 | |
| Junior high school or lower | |||||||
| High school | -.370 | .690 | -1.316 | .268 | -1.272 | .280 | |
| Undergraduate | -.373 | .689 | -1.808 | .164 | -2.177 | .113 | |
| Graduate or higher | -1.010 | .364 | -1.678 | .187 | -2.343 | .096 | |
| Age | .032 | 1.032 | -.032 | .969 | -.021 | .980 | |
| Resident year | .052** | 1.053 | .049* | 1.051 | .070* | 1.073 | |
| Attitude toward recycling | .309 | 1.362 | -.728 | .483 | |||
| Internal subjective norm | .333 | 1.395 | .504 | 1.656 | |||
| External subjective norm | .328 | 1.388 | .110 | 1.117 | |||
| Awareness of recycling benefit | .226 | 1.254 | -.069 | .933 | |||
| Economic incentive | -.316 | .729 | -.353 | .702 | |||
| Perceived space needed for recycling | -.020 | .980 | .370 | 1.448 | |||
| Perceived time needed for recycling | .221 | 1.247 | .099 | 1.104 | |||
| Perceived facility condition | 1.653** | 5.220 | .840** | 2.317 | |||
| Perceived recycling skill | 1.491** | 4.441 | 1.302* | 3.677 | |||
| Adequacy of recycling information | .850* | 2.339 | 1.391* | 4.018 | |||
| Intention to recycle | 5.486** | 241.280 | D D D D ) A | ||||
| ( |