1. Introduction
hina as the world's most populous country, many of its population is living in rural areas and since the 1980s, it experienced a lot of its population moving from rural areas to cities for a better life which lead to vacating out of the countryside (Futian et al., 1994). To surmount unbalanced development between rural and urban areas, China's central government within recent years has adopted policies oriented towards coordinating what is termed a harmonious economic development of urban and rural areas. Among those policies, the most important issues that need to be settled every year are planned to favor the development of rural areas through countryside investment development projects and infrastructure investment as the engine of rural livelihood improvement and economic growth (Han Wang and Yi Zhuo, 2018). The inequalities of the economy between rural and urban regions in China were high but stable during the centrally planned period. Since the establishment of reforms in 1978, China has experienced over three decades of rapid economic growth, the Swift development of transformation from a pre-industrial to an industrial state and growth of cities has pushed economic development and improved international competitiveness while also deeply influencing its vast rural areas and has affected China's transformations of regional rural-urban relationships, with also unbalanced between rural and urban areas in income, infrastructures, together with the change in the quick development of rural industries (Yang et al., 2006). Fixed investment in the rural area refers to the investment in infrastructure construction and purchase of productive fixed assets by the individual, Private companies, government, or any sources of Funds for investment in fixed assets state budgetary appropriation, domestic loans, foreign investment, selfraised funds investment in rural areas while. GDP can be broken down into the contribution of each industry or sector of the economy. The ratio of GDP to the total population of the region is the per capita GDP or mean standard of living which is referred to GDP in the rural area of china in our study. Referring to the inequalities in rural and urban areas to both infrastructural development and economic growth, and as china investment in fixed assets is one of the main measures of capital spending to invest in construction projects in both rural and urban areas, this paper has discussed the relationship between fixed investment and economic growth in rural China as an objective of study. It provided an answer to the question assuming that fixed investment promotes economic growth in rural China and provides the size of its effect. Yet, carry the recommendations; in rely on the promotion of coordinated sustainable development of fixed investment and economy in rural China.
2. II.
3. Indicator Selection and Data Sources
Basing on the research of the relationship between fixed investment and economic growth in rural China, this study selected Total Investment of Farm Households in Fixed Assets and Buildings Construction in Rural Area as the index representing the speed of fixed investment in rural China (RFI) and Gross Social output in the rural area (Term used from 1990-1992) and Total output value, intermediate consumption and valueadded of agriculture, forestry, animal husbandry and fisheries (Term used from 1993-2016) as the index representing GDP in rural China (RGDP) which also represents China's rural economic growth. The study used time series annual data from 1990 to 2016. All indicators were collected and arranged according to the China Statistical Year Book and China Rural Statistical Year Book, as shown in Figure 1.
4. Study Methods
The time series variables are non-stationary. If directly making regression to this time series, there will be the problem of spurious regression (Pseudoregression). To overcome that problem of spurious regression, we firstly used the ADF unit root test to judge whether variables are stationary. If not stationary, it is essential to test whether the variable is single cointegrated and make different processing to make it become a stationary series. So, we make a cointegration test to determine long term relations between variables. The co-integration test needs a Granger causality test. Thus, based on a cointegration test, we tested granger causality to make further analysis of the relationship between fixed investment and GDP in rural China. We used E Views 8.0 software to perform the statistical analysis and test of related data.
IV.
5. Empirical Test and Results
6. a) Unit root test
The unit root test is used to test the stationarity of time series variables (Fixed investment and GDP in rural China), ADF (Augmented Dickey-Fuller) test is the common unit root test method for avoiding the problem of spurious regression. If a time series contains a unit root, it is non-stationary. The results in Table 1show that the time series of variables are non-stationary but after their first order difference processing, the series are stationary which means that the original series is a first-order single cointegrated series, I (1).
7. b) Co-integration Test
The role of co-integration test in Fixed Investment and GDP in rural China is to deal with the economic model using non-stationary time series data and the idea is that if there is a long-run relationship between Fixed Investment and GDP in rural China, then no matter the changes of the variable over time, there will be a common trend to link them together. The literature indicates that co-integration tests include Engle-granger (1987), Johansen (1988), Johansen and Juselius (1990), Pesaran et al (2001), Sørenand Katarina(1990), etc. are used to confirm the presence of potential long-run equilibrium relationship between variables. To conduct the co-integration test in this study, we adopted the Johansen methodology.
Johansen's approach derives two likelihood estimators for the co-integration; one is a trace test and a maximum Eigenvalue test. The Co-integration can be formally tested with the trace and the maximum Eigenvalue statistics. After applying the Johansen procedure as shown in Table 2, we note that both the Trace test and Max-eigenvalue test indicate only one vector of co-integration that means a long-term relationship among the level of fixed investment and GDP in Rural China within the period 1990-2016.
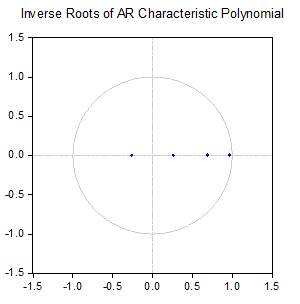
8. c) Model Estimation
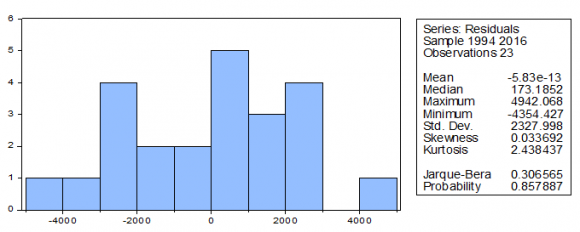
Determination of optimum lag by comparing every lag to the criteria used is the first step taken in VECM Model checking which is most important in time series data analysis. The results in table 3 the maximum values from each of the information criteria are shown by a star (*) which indicated the lag optimum is at lag2 by the selection criteria of the AIC, FPE, HQIC, LR, and SBIC. So we preceded further tests with lags (2) and one co-integration between variables. Checking of the VECM model is which helps to check order if the fitted model is appropriate. The results also showed that the null hypothesis of no serial autocorrelation was accepted for the Godfrey LM test for all lags undertaken and the test of heteroskedasticity of data showed that the null hypothesis of no heteroskedasticity meaning that the residuals are homoscedastic was accepted for Breusch-decided that the model hasno serial autocorrelation and no Heteroskedasticity. Finally, we tested the normally of the monde, and the results (fig. 3) from Histogram residual and the value of the Jarque-Bera test of normality, Null hypothesis (?? 0 ) are rejected for all residuals which indicate that they are all normal.
9. d) Granger Causality Analysis
Through difference processing, the above indicators are stationary and have long-term cointegration relations. Then, we carried out a Granger causality test for these variables. The use of the Granger Causality Analysis test suggests a cause and effect relationship between Fixed Investment and GDP in rural China. Here, the results for the analysis of causality are presented and the causality between the variables (if any) and the direction of the causality of the systems are determined. The results estimate of the test in Table 4 shows that at 5% fixed investment is Granger-causal for GDP, while GDP is not granger cause of fixed investment in rural China. However, there is a unidirectional causality between GDP growth and fixed investment in rural China. The finding implies that fixed investment can promote economic growth in rural China.
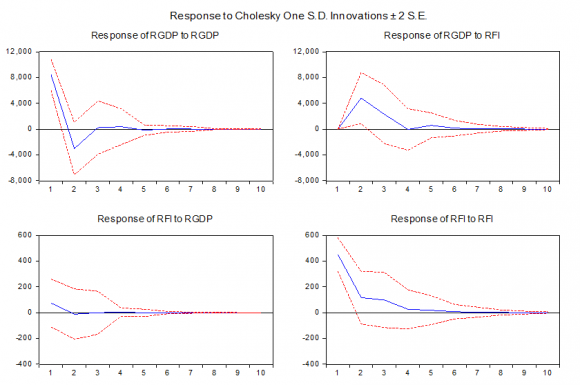
© 2020 Global Journals The performance of Impulse Response Function analysis was used in this study as an additional check of the co-integration test findings and provided information for the long-run relationship between Fixed Investment and GDP in rural China and also provided information to analyze the dynamic behavior of a variable due to a random shock or innovation in other variables and shows the effects on current and future values of the endogenous variables of one standard deviation shock to a variable. We used Cholesky-dof adjusted type of contemporaneous identifying restrictions to draw a meaningful interpretation as shown in figure 4.
Impulse response functions as shown in the above figure shows that a unit shock of RGDP to RFI creates strong positive fluctuations increasing into the future until 10 years from zero and finally dies off. And the response of RFI to a shock in RGDP also creates positive fluctuations, increasing positively into the future for up to 10 years and also finally dies off. It implies the meaningful reciprocal effect between Fixed Investment and GDP in Rural China with the time.
V.
10. Conclusions
By the empirical test of the relationship between fixed investment and economic growth in rural china, we concluded that fixed investment promotes economic growth in rural China. There found also a unidirectional causality between GDP growth and fixed investment and industrial institutions and services which promotes an increase in the total output of rural China.
Enhance rural farming technology, Services, and infrastructure development. It is recommended to guide rural farmers to centralize funds to develop a rural large scale economy by plantation of cash crops to obtain economic benefits and famous brand benefits to boost the rural economy. The government should also help farmers to use better technology and method for farming, reduction of corruption and misbehavior of local government officials and economic assistance to farmers, coordination, and supervision of investment in rural infrastructure development as an investment priority for economic development. Strengthening the cooperation between government, stakeholders, enterprises and private sectors is also a good choice as they respond to the call actively, providing more employment opportunities in the rural areas of China.
Improve countryside revitalization designing measures. The economic development growth through rural fixed investment in rural China also needs to take rural area as a unit to classify different rural areas and urban areas from top to bottom, connect the national and provincial rural revitalization of rural areas, clarifying the spatial structure and designing of township construction, establishment of new governance mechanisms for rural communities and upgrading social security guarantee for rural residents.
Rise of rural output by investing in other rural activities. Even if the study indicated that fixed investment promotes rural economic growth, Taking rural area as a place where is many population living considering to urban area, and considering to the inequalities between rural-urban per Capita income, Investment into Products of agriculture, forestry, fisheries, aquaculture, tourism,... And other rural sectors can affect China's rural economic growth positively. This will not only bring new vitality improvement to the rural population but also relieve urban pressure and contributing to the realization of the Chinese vision for sustainable development.

| Variable | ADF value 1% critical value 5% critical value | 10%critical value P-value Conclusion | ||||
| RGDP | 0.168377 | -3.711457 | -2.981038 | -2.629906 | 0.9649 Non-stationary | |
| ?RGDP | -5.726859 | -3.724070 | -2.986225 | -2.632604 | 0.0001 | Stationary |
| RFI | 0.423920 | -3.711457 | -2.981038 | -2.629906 | 0.9801 Non-stationary | |
| ? RFI | -3.330422 | -3.724070 | -2.986225 | -2.632604 | 0.0241 | Stationary |
| Sample (adjusted): 1990-2016 | ||||
| Included observations: 24 after adjustments | ||||
| Trend assumption: No deterministic trend | ||||
| Series: RGDP RFI | ||||
| Lags interval (in first differences): 1 to 1 | ||||
| Unrestricted Cointegration Rank Test (Trace) | ||||
| Hypothesized | Trace | 0.05 | ||
| No. of CE(s) | Eigenvalue | Statistic | Critical Value Prob.** | |
| None * | 0.559647 | 22.41455 | 12.32090 | 0.0008 |
| At most 1 | 0.107529 | 2.730275 | 4.129906 | 0.1164 |
| Trace test indicates 1 cointegrating eqn(s) at the 0.05 level | ||||
| Unrestricted Cointegration Rank Test (Maximum Eigenvalue) | ||||
| Hypothesized | Max-Eigen | 0.05 | ||
| No. of CE(s) | Eigenvalue | Statistic | Critical Value Prob.** | |
| None * | 0.559647 | 19.68428 | 11.22480 | 0.0013 |
| At most 1 | 0.107529 | 2.730275 | 4.129906 | 0.1164 |
| Max-eigenvalue test indicates 1 cointegrating eqn(s) at the 0.05 level | ||||
| Because both trace statistic and Maximum | ||||
| Eigenvalue reject the null hypothesis of no co-integration | ||||
| among variables i.e. Trace Statistic and Maximum | ||||
| Eigenvalue values are more than Critical Value at 5% | ||||
| (22.41455>12.32090; 19.68428>11.22480) and are | ||||
| significant (0.0008<0.05, 0.0013<0.05). Since the | ||||
| variables are cointegrated, we then proceed to use the | ||||
| Restricted VAR Model (VECM) and not Unrestricted VAR | ||||
| model in modeling the selected variables. | ||||
| 19 | |||||
| Volume XX Issue VIII Version I | |||||
| E ) | |||||
| ( | |||||
| Lag | LR | FPE | AIC | SC | HQ |
| 0 | - | 1.73e+14 | 38.46113 | 38.56032 | 38.48449 |
| 1 | 95.84936 | 1.61e+12 | 33.78006 | 34.07762 | 33.85016 |
| 2 | 16.20309* | 9.05e+11* | 33.19058 | 33.68650* | 33.30740* |
| 3 | 2.939937 | 1.10e+12 | 33.35822 | 34.05252 | 33.52177 |
| 4 | 1.415685 | 1.50e+12 | 33.61295 | 34.50563 | 33.82324 |
| 5 | 5.355699 | 1.46e+12 | 33.48971 | 34.58075 | 33.74673 |
| * indicates lag order selected by the criterion | |||||
| Null Hypothesis | F-statistics | Probability | Decision |
| RFI does not Granger Cause RGDP | 5.06622 | 0.0172 | Reject |
| RGDP does not Granger Cause RFI | 0.06344 | 0.9387 | Do not |
| reject | |||
| RFI: Fixed Investment in Rural China | |||
| RGDP: GDP in Rural China | |||
| e) Impulse Response Functions (IRFs) |