1. Introduction
ndicators are crucial to guide decision-makers in a variety of public policy directions. The information generated by them facilitates the decision-making process and can help measure the success of policies aimed at sustainable development.
In 1992, there was a large reorganization of the indicators list. Such reorganization allowed countries to create information that helps in sustainable development decisions being articulated in the Agenda 21, that contain the objective of devel oping and identifying sustainable development indicators that could provide a sound basis for decision-makers at all levels. Also, the Agenda 21 draws attention to the development and harmonization of the sustainable development indicators at the regional, national, and global levels, including the incorporation of a suitable set of these in common indicators (UN, 2001).
In response to Agenda 21, the Commission for Sustainable Development (CSD) approved the Work on Indicators of Sustainable Development program in 1995. The objective of thi s program was t o create sustainable development indicators accessible to decision-makers at the national level (UN, 2001).
Creating a structure to organize the selection and development of sustainability indicators is essential for the regionals classification in terms of sustainable development and possible decision-making . The need to create this structure and the choice of a set of indicators can be measured by the priority established by its users, in this case: specialists, civil society and decision makers, resp onsible for the devel opment and use of indicators for the monitoring of the sustainable development process (UN, 2001).
Based on the recent construction of sustainable development indicators suggested in the literature, it is possible to assess situations and trend s, besides comparing and classifying locations and describe their situation about the ideal scenario providing early warning information as well as predicting future conditions and trends. The aim of this study was to construct a methodol ogy that would allow ranking the 78 municipalities that make up the State of Mato Grosso do Sul (Brazil), using the Municipal Sustainable Development Index (MSDI),as from the indicators of the social, economic and environmental dimensions using the data envelopment analysis (DEA) as a tool.
Thus, this work is organized into three sections, besides thi s introduction. The first one disc usses the emergence and applications of sustainable development indices in Brazil and in the World. The second section discusses a methodology suggestion for the devel opment of a Sustainable Development Indicator for the municipalities of Mato Grosso do Sul. Section three analyzes the results obtained by applying the proposed methodology to a set of representative indicators of the proposed topics, ranking the municipalities of Mato Grosso do Sul on the issue of sustainability.
2. II. Indices of Sustainable Development in
Brazil and in the World
On a domestic and global scale, several indices have arisen, especially, over the past decades, including: the Environmental Sustainability Index; Ecological-Economic Efficiency Index, Consumer Pressure Index; Ecological Footprint Index; Sustainable Economic Welfare Index; Genuine Progress Index, among others (Jollands, 2006).
The starting point for analysis and assessment of sustainable development i s based on the construction of proxy indicators to describe briefly the aspects of sustainability as in Ronchi et.al. (2002), Nourry (2008) and Nader et al. (2008). However, there is no perfect or unique way of measuring the sustainable development. There i s a need to analyze di fferent development, and sustainability indicators to find out the best way to assess a country's sustainable development (Nourry, 2008).
In the version of the Commissi on for Sustainable Development , the set of sustainable development indicators developed between 1994 and 2001. These devel oped indicators have been extensively tested, applied, and used by many countries as the basis for the development of national indicators of sustainable devel opment (UN, 2007). The choice for a set of indicators needs to take into account its efficiency regarding the interpretative process, synthesizing the complexity of the research object (MANZONI, 2006).
According to Roldán and Valdés (2002), who calculated Sustainable Development Indices for seven Mexican municipalities, located within the Coatzacolcos River basin region, using as a reference the methodology of Agenda 21 and the Organization for Economic Cooperation and Development OECD), the selection of relevant indicators should be established according to the following criteria: Availability and reliability of the data source; Use of current statistical data; Use of data belonging to the three systems: economic, social and environmental of all municipalities involved in the research; Holistic approach, which included qualitative and quantitative data in an integrated way.
In the international community, researches related to sustainability and sustainable development are in a more advanced and in-depth rhythm. Proof of this are magazines, universities, and even research centers focused on the subject, as the work of Cavalcanti (2010) points out.
To supply synthetic indicators for measuring sustainable development, recently applications are noteworthy. They are noteworthy because they deal with the construction of these indicators, as it is desired in this work, with the approach of sustainable development in an integrated manner, being these the works of Ciegis, Ramanauskiene and Startiene (2009); Rinne, Lyytimäki and Kautto (2013); Hák, Janou?ková and Moldan (2015); Bravo (2013).
These applications, besides their outstanding contributions to the method, they mainly give a key design on the scale that the ecological indicators or indicators of sustainability have been taking over time. Moreover, it is up to them to demand the treating of a broad and complex c ontext of human interaction with the environment in a synthetic, simple and clear way, to enable decision-making and policy-making. About this perception Zurlini and Girardin (2008) present an important reflection: "Thus, indicators need to be constantly re-evaluated and re-interpreted in the li ght of the increasing understanding of the whole organization and functioning of social-ecological sy stem s."
To combine mathematical, methodological and theoretical efforts in the search for indicators that better reflect the addressed reality, making it possible to review what i s laid, besides suggesting new methodologies, Ciegis, Ramanauskiene and Startiene (2009), point out: "Therefore, assessm ent of sustainable development needs integrated approach, a set of multi-dimensional indicators, which evaluate both separate parts of the system and their relationships". Thus, it is given the praxis indications for the elaboration of indicators of this nature. It is a great example of the relevance theme, the Economic Commissi on for Latin America and the Caribbean (ECLAC), as well as the recently launched Agenda 2030 y losobjetivos de Desarrollo Sostenible uma oportuni dade para América Latina y el Caribe (2017). They make a set of actions for the intensification of sustainable development for Latin America and the Caribbean to contribute to the public agendas formulation.
The work of Henriquez and Herrera (2012) makes a descriptive analysis of the initiatives for sustainable development in Latin America on the aspects of foreign direct investment, development of goods and products industries, besides other factors seeking to understand their influence on sustainable development in Latin America.
Also the ECLAC's rep ort Acesso a la informacíon, partici pacion y justicia en temas ambientales em América Latina y el Caribe: Situación actual, perspectivas e ejemplos de buenas práticas, presents a case study perspective and highlights as one of the challenges for the environmental i ssues in Latin America: the need to improve information processing "A fin de que la ciuda danía pueda partici par de manera informada en la toma de deci siones em materia ambiental, se requiere mejorarlas capaci dades de producir, procesar y difundir información sobre el estado delmedio ambiente a nivel nacional .".
In Brazil, the main official method ological approach is the periodic survey of IBGE -Brazilian Institute of Statistical Geography, beginning in 2002, and updated and revi sed in 2004, 2008, 2010, and 2008). An important point for the c onstruction of synthetic indices is the data availability, the critical issue pointed out by the IBGE report itself (2015) for the survey years of sustainable development indicators in Brazil demonstrating the difficulty of adjusting some variables mainly with their periodic availability for data collection.
Even given the efforts observed by IBGE and ECLAC, it should be noted that there is a way to be followed about to the method and concept, so that the indicators currently used and calculated can converge more and more towards the direction indicated in the international literature, observing obviously the local specificities. In thi s context, the elaboration and use of municipal sustainable development indicators to carry out this study followed the development proposed by Roldán and Valdés (2002). It was taken into account the specificities of the Brazilian economy and, in particular, the state of Mato Grosso do Sul, but seeking to connect to the broad reflection on indicators carried out by researchers worldwide on the topic.
3. III.
4. Material and Methods
The methodol ogy prop osed in this article for calculating the Municipal Sustainable Development Index (MSDI) considered all seventy-eight (78) municipalities in the State of Mato Grosso do Sul (Brazil), including the economic, social and environmental representativeness with the purpose of assessing the sustainability levels, considering the globally used criteria for the choice of sustainability indicators. According to Martins and Cândido (2008), each of the selected indicators should have the following characteristics: a) Be significant for the reality investigated and for the study focus, b) Be relevant to the decisions that guide public policies, c) Reflect the temporal changes, d) Enable an integrated and systemic approach, e) Use measurable indicators, f) Be easy for interpretation and communication, g) Have a well-defined , transparent and objective methodology for research purposes.
In addition to these listed criteria, the main reason for the choice of indicators was the availability of statistical data for all Mato Grosso do Sul municipalities. For a definition of the indicators representing aspects of economic, social and environmental development, a normalization of data was performed , to enable an analysis of different units and sizes of municipalities.
Waquil et.al.( 2010), suggested the methodology used to define the indicators featuring the geographical areas in a multidimensional way through the perception of their personal distinctions and identities. Moreover, the publication of "Indicators of Sustainable Development: Brazil 2002," the Brazilian Institute of Geography and Statistics (IBGE), became a guide for preparing the set of indicators that would allow complete assessment of sustainability, considering the peculiarities and characteristics of the Brazilian and Mato Grosso do Sul reality.
Casado and Souza (2008) determine the MSDI, researchers have used data envelopment analysis concepts -DEA (Data Envelopment Analysis), whose non-parametric technique uses mathematical programming to build production efficiency frontiers of production units -DMUs (Decision Making Units), which use similar technological processes to transform multiple inputs into multiple products.
Also, according to Casad o and Souza (2008), the DEA efficiency frontiers are used to evaluate the relative efficiency of the operational plans run by the DMUs and serve as a reference for the establishment of efficient g oals for each production unit. The DEA assess the effectiveness of organizations whose activities are not aimed at profit or for which there are no pre-set prices for all input s and or all products.
Thus, the DEA objective is to find the best virtual DMU for each DMU in the sample. According to Charnes et al. (1994), the virtual DMU is better than the original DMU for producing more with the same amount of inputs, or because it produces the same quantity using fewer inputs. The original DMU will be inefficient. Therefore, the production efficient frontier will be the one that represents the assessed units can to maximize the inputs used in the products produced or, still, manages to produce a greater quantity of products with a smaller amount of inputs.
To use the DEA in the analysi s of social, economic, and environmental indicators, some indicators were defined as inputs (inputs) and others such as products (outputs). Charnes et al . (1994) emphasize the efficiency as a relative concept, that i s, the efficiency 1 (one), or 100% , is achieved by a unit when compared with other units showing neither inefficiency evidence in the input use nor the product output. In other word s, the units that achieve maximum performance about others will be considered technically efficient. Still, it does not mean that they are necessarily efficient absolute terms. A DMU technical efficiency can range from 0 (zero) to 1 (one), so that, whenever closer to 1, the higher will be the DMU efficiency degree.
There are two techniques used in DEA: the constant return scale, also called CRR or CRS (Constant Returns to Scale), originally developed by Charnes et al. (1978) and the variable return of scale, called BCC or VRS (Variable Returns to Scale), developed by Banker et al. (1984). The difference between one technique and the other is that, in the first , the input and product (output) variables undergo proportional or c onstant changes, in the second technique, these changes are variable.
For Gomes et al. (2003), in the classic DEA techniques, both in the CCR technique and in the BCC technique, it is assumed total freedom of production, that is, the production of one DM U does not interfere in the production of the others. Also, according to the authors, how the inefficient DMUs are projected at the efficiency frontier is the way that determines the model orientation.
DEA models can be input or product (output) oriented, and the analyst as the starting point in the DEA analysis must choose this orientation in advance. The input orientation indicates that it is desired to reduce (minimize) the inputs, keeping the products (output) unchanged. On the other hand, product orientation means that one wants t o increase the products (output) without changing the input (Lins et al., 2000).
In the present research, we used the inputoriented technique, in which the resources used for each of the aspects were considered to evaluate the sustainability separately and to determine an average of efficiency to create a classification of the municipalities in relation to the obtained results.
Therefore, we started from the following equations in a primal solution:
subject to: (1)(2)Where: u r, v i > 0; r = 1, ...,s ; i= 1, ..., m.
The above model is a linear fractional programming model that can be transformed into a common linear form so that we can use conventional linear programming method s. Thi s transformation takes place as follows: Input-oriented (primal) CCR model:
(3) subject to:
(4)(5) (6) (7)Other DEA basic model would be the DEA-BCC that presents the frontier's surface with variable returns of scale. Developed by Banker, Charnes and Rhodes (1984) this model is relevant to the study of efficiency because it admits that not always, the technology presents constant returns to scale and this return may decrease, grow or even getting constant as it increases or reduces the production scale.
In the DEA-BCC model, having in view the frontier's surface change to the model's fractional formula, the variable (omega) will be added to represent that it is possible to vary the surface, resulting as follows:
DEA-BCC input-oriented (primal) model: Note that structurally the CCR and BCC models are similar. In BCC, the scores can be equal to or smaller than one. In the second restriction, the variable was al so added. There i s one more restriction for convexity .
The first procedure prior to the DEA application was to define the social, economic and environmental development indices, SDI, EDI and EnD), respectively, which would be representative of the social, economic and environmental indicators, as well as of each function (input/output) within the resource use process. The inputs/outputs were defined based on the economic literature of indicators and mainly by the availability of indicators that reflected in a social case. As an example an important social input that generated, therefore, a social output, that is, for example, increases in the revenues received by the SUS-(Unified Health System, the public health system in Brazil), can lead to a reduction in infant mortality, thus the listed inputs and outputs assume correspondence with each other. Thus, the municipal sustainable development index (MSDI) was calculated from the aggregation of the three The first step consisted of secondary data searches that had municipal cuts from several Brazilian sources, in which it was possible to select the indicators to be used in the DEA in the calculation of SDI, EDI and EnDI indicators. For eac h selected indicator it was defined: its size, function, source used and year of collection (Chart 1). Some municipal indicators, in absolute values, were normalized, based on the population of each municipality, to facilitate the results' comparisons. Thus, the data compilation and the indicators development that provide simple and comparable information for different sizes of municipalities have proved to be necessary.
In the second step, the indicators were inserted in the DEA models, respecting the social, economic and environmental dimensions. With the use of SIAD software, which allows for the resolution of these models, it was possible to generate the three indices: SDI, EDI and EnDI, of the social, economic and environmental development aspects, respectively, for subsequent synthesis and production of the municipal sustainable development index (MSDI). First, we tested the DEA-CCR model and , later, the DEA-BCC model. The results were compared in order to define which In the third step, after the decision on the DEA results, for each of the calculated SDI, EDI and EnDI indicators, they were aggregated to form the MSDI indicator. The construction of this index is an empirical work based on the methodol ogy originally proposed by Cândido and Vasconcelos (2010), by the use of indices weighted by topic to compose the Municipal Sustainable Devel opment Index (MSDI). In this work, equal weights were established for the three indicators generated by the DEA, so that expression (1) represented the simple arithmetic mean of the three indicators, representative of each of the issues of social, economic and environmental devel opment.
5. MSDI =
SDI +EDI +EnDI 3 (12) Where: EDI = economic development index; SDI = social development index; EnDI = environmental devel opment index.
The MSDI index ranges from 0 to 1, the same variation of each indicator that goes in its composition, and its result expresses the direct prop ortionality of its value with the level of the municipal sustainability, so that, the closer to 1, the more sustainable is the indicator. Sá Barreto et al. (2005) classified he MSDI according to the following scale: 0,0<MSDI< 0,5 -Low level of municipal sustainable development; 0,5<MSDI< 0,8 -Average level of municipal sustainable devel opment; 0,8<MSDI< 1,0 -High level of municipal sustainable development.
The MSDI found was operationalized for the standard analysis of the studied municipality development from the chosen indicators based on the theory and the recent literature on the subject. The application of DEA method for calculating sustainability indices is very little disseminated, they are used in most of the works of national literature the Ecological Footprint Method, systematization and parameterization of representative indicators, Barometer of Sustainability, SDI-IBGE among other techniques as noted in the works of Rabelo and Lima (2007), Vasconcelos (2011), Guimarães and Feichas (2009). Only Macedo, Cruz and Ferreira (2011) use the DEA method for thi s purpose, but in a completely different way from the application proposed here.
6. IV. Results Obtained by the MSDI for the Municipalities of Mato Grosso Do Sul
For the present research, we considered the 78 municipalities of the State of Mato Grosso do Sul, treated as DMUs. It was used for each of them the same orientation approach for inputs of the DEA-BCC and DEA-CCR models, applied to social, economic, and environmental indicators in each studied municipality, to allow their data classification according to the MSDI. The indicators observed in this study to delineate the indices of social, economic, and environmental development are presented and discussed below.
In Table 1, the municipalities are listed, accompanied by their respective SDI-Social Development Indices, calculated by both, the DEA-CCR method and the DEA-BCC method, and which presented efficiency level s above 0.80. By applying the DEA-BCC, 20 municipalities were considered as efficient, value (1.0) from the standpoint of social aspect. With the DEA-CCR, 10 municipalities were considered efficient. This shows that for the data sample on social aspects the DEA-BCC is the model that better represents the efficiency frontier.
In Table 2, the municipalities are listed, accompanied by their respective EDI indicators, calculated both by the DEA-CCR method and by the DEA-BCC method , which presented efficiency levels above 0.75. The results point to 20 municipalities as efficient, value (1.0), by the DEA-BCC method, and 14 municipalities by the DEA-CCR method. However, the municipalities considered efficient in the social indicator are not the same ones obtained by the economic indicator, except for Chapadão do Sul , Ladário and Paranhos, which were efficient by the DEA-BCC in both aspects. The municipality of Paranhos was the only one considered efficient by the DEA-BCC in both aspects. The values again point to the DEA-BCC model as the one more adjusted for the data sample related to the economic aspects.
Considering the environmental aspect, Table 3 shows the results of the DEA-BCC and DEA-CCR models, and that presented efficiency levels above 0.75. Volume XX Issue V Version I
7. ( H )
Using the DEA-BCC method , 9 municipalities were considered as efficient, value (1.0), whereas by the DEA-CCR method there were 7 municipalities. Again, for the sample environmental aspect, the DEA-BCC model was considered the most suitable one to represent the efficiency frontier behavi or also in the environmental dimension.
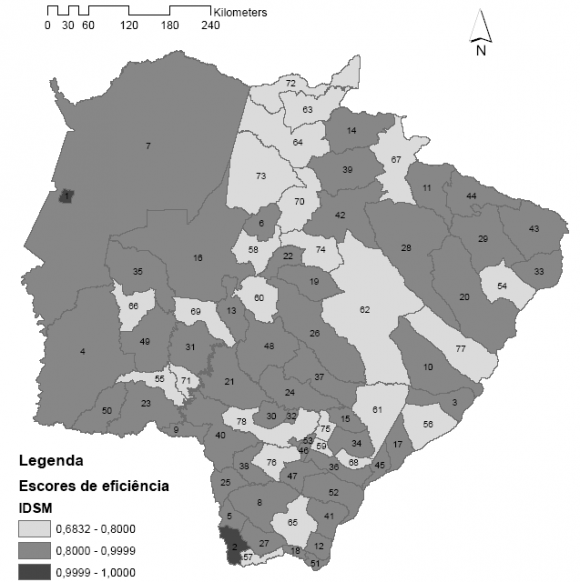
The sec ond methodological step would be to aggregate the indicators obtained to construct a single indicator on the three aspects through equation ( 1) defined in the previous section. The results presented only two municipalities classified as efficient in the three aspects. To better analyze the results, in Figure 1 There were no municipalities in the range of 0.0 <MSDI<0.5, first interval, which identifies the municipalities with lower efficiency according to the presented method. Only two municipalities among the 78 municipalities of Mato Grosso do Sul (MS) were identified as the most efficient, obtaining grade 1 in all dimensions, SDI, EDI, EnDI for DEA-BCC, being they: Ladário and Paranhos. The other municipalities were classified according to their efficiency scores: the average level of sustainable development of municipalities within the range of 0.5000 <MSDI<0.8000; municipalities with high levels of sustainable development for the municipalities in the range of 0.8000 <MSDI<0.9999; and a third interval for municipalities considered efficient of 0.9999 <MSDI<1.0000.
Source: Research data. The municipalities considered with an average level of municipal sustainable development are l ocated in all the micro-regions, not presenting thus a trend in a determined region. The same occurs with the other levels of efficiency scores; there i s not a spatial distribution pattern of results or even a trend towards concentration in a given micro-region of the municipalities with better or worse results.
What draws attention would be the second largest municipality in terms of population comes last in the MSDI ranking. Part of the explanation for this result is one of the worst levels of efficiency in the economic indicator combined with one of the worst levels of environmental efficiency.
V.
8. Conclusions
The set of MSDI indicators has shown that fragilities and potentialities can appear in any aspect and their solutions can become highly complex, requiring the planners and municipal managers' political will. It was possible to verify that the sustainability of only two municipalities out of the investigated and, thus, to portray more realistically the fragilities and the potentialities of this set of municipalities. In applying the methodology, the DEA-BCC model presented a greater number of efficient municipalities, pointing to a technology of returns with variables of scale more appropriate to deal with the theme of sustainability.
One aspect that demonstrates the weakness in relation to the municipalities of Mato Grosso do Sul refers to the economic i ssue, with low rates of public and private investment, high unemployment and low GDP per capita. The adopted methodology, from the transformation of indicators into indices, in the three aspects studied (social, economic and environmental), that, when aggregated produce the MSDI, can contribute to the feasibility of a regional reality scenario, allowing the information generation that favors interactions between planners, and managers, and the environment for the appropriate decision-making . Thus, the methodol ogy used proved to be interesting for comparative studies among localities, and can offer significant contributions to the decision-making process and for the implementation of public policies and local development.
The DEA used for the indices c onstruction allows the replication, comparability and, mainly, it assigns a calculation tool consistent with the economic theory and with the sustainability issues. The DEA low use for these purposes gives to work a method ological differential compared t o the classical techniques of obtaining sustainability indices, lying there its main contribution.
It is also important to highlight that this is a broad topic, with a great need for production, especially for Latin America and Brazil, as it was possible to perceive in this work. In this regard, the application of more suitable methods to determine which indicators to use in the index synthesizing, the dimension of the concept used as well as the DEA refinement for these purposes are still weaknesses to be researched and developed in this field of study.
| Indicator | Dimension | Function | Source | Year |
| Income Gini I ndex | Social | Input | IBGE | 2010 |
| SUS Revenue Received | Input | National Treasury | 2010 | |
| Education R evenues | Input | National Treasury | 2010 | |
| Infant mortality | Output | IBGE | 2010 | |
| Illiteracy | Output | IBGE | 2010 | |
| HDI-Human Development Index -school | Output | IPEA | 2013 | |
| attendance | ||||
| Private investment rate | Economic | Input | National Treasury | 2010 |
| Public investment r ate | Input | National Treasury | 2010 | |
| Energy intensity | Input | ENERSUL | 2010 | |
| Unemployment rate | Output | IBGE | 2010 | |
| GDP per capita | Output | IBGE | 2010 | |
| Piped water | Environment | Input | Sanesul | 2010 |
| Sanitation | al | Input | IPEA | 2010 |
| Fleet vehicles | Output | DETRAN/MS | 2010 | |
| Fuel consumption | Input | Distributors | 2010 | |
| Use of fertilizers | Output | ANDA | 2008 | |
| Natural Areas | Output | IBGE | 2010 | |
| Source: Prepared by the authors. | ||||
| CCR, in 2010 | |||
| Municipality | SDI (DEA-BCC) | Municipality | SDI (DEA-CCR) |
| Bela Vista | 1,0000 | Bela Vista | 1,0000 |
| Cassilândia | 1,0000 | Cassilândia | 1,0000 |
| Douradina | 1,0000 | Douradina | 1,0000 |
| Eldorado | 1,0000 | Eldorado | 1,0000 |
| Japorã | 1,0000 | Japorã | 1,0000 |
| Jardim | 1,0000 | Jardim | 1,0000 |
| Jateí | 1,0000 | Jateí | 1,0000 |
| Nova Alvorada do Sul | 1,0000 | Nova Alvorada do Sul | 1,0000 |
| Paranhos | 1,0000 | Paranhos | 1,0000 |
| Porto Murtinho | 1,0000 | Porto Murtinho | 1,0000 |
| Campo Grande | 1,0000 | Campo Grande | 0,9997 |
| Fátima do Sul | 1,0000 | Fátima do Sul | 0,9676 |
| Maracaju | 1,0000 | Maracaju | 0,9676 |
| Rio Negro | 1,0000 | Rio Negro | 0,9162 |
| Santa Rita do Pardo | 1,0000 | Santa Rita do Pardo | 0,9046 |
| Ladário | 1,0000 | Ladário | 0,8855 |
| Municipalities | EDI (DEA-BCC) | Municipalities | EDI (DEA-CCR) |
| Amambai | 1,0000 | Amambai | 1,0000 |
| AntônioJoão | 1,0000 | AntônioJoão | 1,0000 |
| Aparecida do Taboado | 1,0000 | Aparecida do Taboado | 1,0000 |
| Bataguassu | 1,0000 | Bataguassu | 1,0000 |
| Chapadão do Sul | 1,0000 | Chapadão do Sul | 1,0000 |
| Coronel Sapucaia | 1,0000 | Coronel Sapucaia | 1,0000 |
| Corumbá | 1,0000 | Corumbá | 1,0000 |
| DoisIrmãos do Buriti | 1,0000 | DoisIrmãos do Buriti | 1,0000 |
| Ladário | 1,0000 | Ladário | 1,0000 |
| Laguna Carapã | 1,0000 | Laguna Carapã | 1,0000 |
| Paranhos | 1,0000 | Paranhos | 1,0000 |
| Rio Negro | 1,0000 | Rio Negro | 1,0000 |
| Rochedo | 1,0000 | Rochedo | 1,0000 |
| Taquarussu | 1,0000 | Taquarussu | 1,0000 |
| Jaraguari | 1,0000 | Jaraguari | 0,9696 |
| Alcinópolis | 1,0000 | Alcinópolis | 0,9228 |
| Aral Moreira | 1,0000 | Aral Moreira | 0,9164 |
| Inocência | 1,0000 | Inocência | 0,8608 |
| Figueirão | 1,0000 | Figueirão | 0,8211 |
| Água Clara | 1,0000 | Água Clara | 0,7648 |
| CCR method s, in 2010 | |||
| Municipalities | EnDI(DEA-BCC) | Municipalities | EnDI (DEA-CCR) |
| Bataguassu | 1,0000 | Bataguassu | 1,0000 |
| Coronel Sapucaia | 1,0000 | Coronel Sapucaia | 1,0000 |
| Japorã | 1,0000 | Japorã | 1,0000 |
| Ladário | 1,0000 | Ladário | 1,0000 |
| Novo Horizonte do Sul | 1,0000 | Novo Horizonte do Sul | 1,0000 |
| Paranhos | 1,0000 | Paranhos | 1,0000 |
| Selvíria | 1,0000 | Selvíria | 1,0000 |
| Porto Murtinho | 1,0000 | Porto Murtinho | 0,9836 |
| SeteQuedas | 1,0000 | SeteQuedas | 0,9755 |
| A Methodological Proposal for the Construction of Municipal Sustainable Development Indices using | |
| Data Envelopment Analysis | |
| Resources, Governance and Ecology, 5 (1), 1834, | |
| 2006. Disponível em: http://www.inderscience. | |
| com/jhome.php?jcode=ijarge. | |
| 17. LINS, M .P.E.; ANGULO-MEZA, L. Análise Envoltória | |
| de Dados e perspectivas de integração no | |
| ambiente de Apoi o à Decisão. Rio de Janeiro: | |
| Editora da COPPE/UFRJ, 2000. | |
| 18. MACEDO, M . A. da Silva; CRUZ, C. F. da; | |
| FERREIRA, A. C. de Souza. Índice de | |
| Year 2020 | desenvolvimento sustentável: uma análise apoiada em DEA para os municípios do Rio de Janeiro. Gestão e Regionalidade, São Caetano do Sul, v.27, n.81, p. 19-31, set ./dez. 2010. 19. MALHEIROS, T. F.; PHILIPPI JR., A.; COUTINHO, S. M.V. Agenda 21 e indicadores de desenvolvimento sustentável: contexto brasileiro. Ecological Indicators, 2, 197-210, 2002. Disponível em: http://www.sciencedirect.com/science/journal/ 1470160X/44/supp/C. 30. SÁ BARRETO, Ricardo Candeas; KHAN, AhmaadSaeed; LIMA, |
| ( H ) | |
| Global Journal of Human Social Science - |