1.
isaster, when anyone heard about that utterance, the first trounce of consideration is damage, pain fatality and other negative reflections on the mind thought process, all these comes in mind because directly or indirectly they are related to community. Community is always in the nucleus of any learning. For example when any disaster strikes in the uninhabitated zone the amount of natural or human allied losses are less counted and on the other hand, with the same intensity, when it strikes at the populated zone the amount of loss it counts a lot. Impact on community makes disasters more prominent. Risk of damage is high in populated zone in comparison to uninhabitated zone. In simple words -Disaster risk is the probability of a hazard occurring and creating a loss.? Disaster Risk is the actual exposure or threat of hazard on humans and is often referred as the product of probability of loss.
2. To find the exposure, resistance, resilience, vulnerability, hazard and management status with the help of PRA (Participatory Rural Appraisal) tools. 3. To investigate the major causes of disasters in the area and, 4. Finally suggesting a management plan for the region.
To make the work effective and factual, authors have used both the primary and secondary data:
1. Collection of primary data by using PRA tools and conducting interviews for ground reality, 2. Study the region and assess different disasters.
2. Collection of secondary data for analyzing,
explaining, and combining the information from the primary source with additional information. 4. Using Ilwis 3.7, Arc 9, Statistica 8 for mapping and clustering and other purposes, Community Based Disaster Management Planning (CBDMP) is an assertion which involves the local community perception and participation in disaster management planning. CBDMP involves communities in identifying, assessing and acting jointly to reduce disaster risks. In the same time when we engage the local communities in diverse disaster risk scenarios, e.g. exposure, resistance, resilience, vulnerability, hazards, management etc, it is known as Community Based Disaster Risk Analysis (CBDRA).
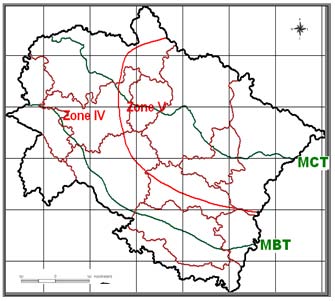
Uttarakhand, located in the northern part of India, extending from 28º 43' N to 31º 27' N latitude and 77º 34' east to 81º 02' E longitude, is the 27th state of the Republic of India and was carved out of Uttar Pradesh on 9th Nov 2000. The state is bordering, Nepal in the East, Himachal Pradesh in the west, China in the North, Uttar Pradesh in the South. Vulnerability is a product of three dimensions: (i) Exposure, which is a largely a product of physical location and the character of the surrounding built and natural environment. (ii) Resistance, which reflects socio-economic, psychological and physical health and their systems of maintenance, and represents the capacity of an individual or group to withstand the impact of a hazard.(iii) Resilience, to natural hazard is the ability of an actor to cope with or adapt to hazard stress. The above table show that the exposure (69.23) and resilience (34.09) level of the Mandal village is low amongst all, with the score of 73.68 and resistance level of Lumti village is low. In total vulnerability of Mandal village with 60.75 score is the lowest and Barsundhi village with 87 score is the highest.
3. M = Management
Disaster Risk Analysis: Disaster Risk Analysis of the selected villages is done using the following formula: The household management analysis principally needs three categories of data i.e. Pre-disaster data, during disaster data, post disaster data. For the present study selected villages household data has been collected through PRA during field visit (Table 5).
4. Table 5: Household management analysis
The above table shows that the prevention level of all the villages fluctuates from 78.94% of Mandal village to 24.20% of Barsundhi village. It is because Mandal is connected with a town. Preparedness level of all the villages is below 22 % and the mitigation conditions are also very poor below 40%.Therefore it can be assessed that pre disaster scenario of all the selected villages is very gloomy. In during disaster section response level varies from 0 to 24% means, community participation level varies from 5 to 80%, and rescue and relief scores between 21.42% to 59.99%. In post disaster section damage assessment is 29.99% in Lumti village because of inaccessibity while in Barsundhi and Dhari damge assessment registers 100% score. Community health related score is below 35% and rehabilitation and restructuring is also below 50%, so it can be said that disaster management planning is in a very poor condition in all the phases of disasters.
5. Global Journal of Human
Communities are the first to be affected by any hazard and first who respond to the disasters so it is imperative to give the community participation a proper place in disaster management and disaster risk related plans and programmes. Over the past few years -CBDRM? is gradually becoming common in the area of rural development. It is a discipline that involves preparing for disaster before it occurs or in pre disaster phase, e.g., prevention, mitigation and preparedness etc, helping in during disaster phase, e.g., response, emergency evacuation, quarantine, mass decontamination, rescue and relief etc., as well as post disaster phase e.g. damage assessment, community health, supporting, restructuring and rehabilitation of society.


| 2012 |
| ebruary |
| F |
| S.No | Village Name | Block Name | District Name | Lat/Long of the Village |
| 1 | LUMTI | Dharchula | Pithoragarh | 80°19'27.023"E 29°53'01.792"N |
| 2 | POTHING | Kapkot | Bageshwar | 79°51'54.803"E 29°58'36.135"N |
| 3 | DHARI | Naugaun | Uttarkashi | 78°08'51.777"E 30°44'28.158"N |
| 4 | BARSUNDHI | Agastyamuni | Rudraprayag | 79°07'08.746"E 30°26'05.232"N |
| 5 | MANDAL | Dhasoli | Chamoli | 79°16'13.922"E 30°27'51.743"N |
| Village Name | Total Population | Number Household | Medium Transportation | Main Crops | Hazards | ||||
| LUMTI | 355 | 76 | Private Jeeps | Paddy, Wheat | Landslide, Earthquake, Forest fire. | ||||
| POTHING | 5439 | 578 | Bus, Private Jeeps | Wheat, Paddy, Barley, Maize, Maduva | Landslide, Earthquake, Forest fire. | ||||
| DHARI | 102 | 22 | Bridle path to village only | Wheat, Paddy | Landslide, Earthquake, Forest fire, Flash Flood. | ||||
| BARSUNDHI | 120 | 25 | Bridle path to village only | Wheat, Paddy, Maduva, Soybean | Landslide, Earthquake. | ||||
| MANDAL | 630 | 135 | Private Jeeps | Wheat, Paddy, | Landslide, Earthquake, | ||||
| Maduva | Forest Fire, Drought. | ||||||||
| b) Village Data Analysis | preparedness, | mitigation, | search, | rescue | and | ||||
| Date related to vulnerability (exposure, resistance, and resilience), Hazard (Frequency and severity), Management echelon (prevention, | evacuation) of the selected villages have been calculated from the data collected through PRA (Participatory Rural Appraisal) and interviews (Table 3). | ||||||||
| Village Name | Exposure | Resistance | Resilience | Vulnerability | Hazard | Management |
| (a) | (b) | (c) | (a + b + c ) /3 | |||
| LUMTI | 76.92 | 73.68 | 56.81 | 69.13 | 22.16 | 10 |
| POTHING | 84.61 | 84.21 | 45.45 | 71.42 | 20.16 | 10 |
| DHARI | 84.61 | 84.73 | 72.72 | 80.68 | 19.83 | 10 |
| BARSUNDHI | 76.92 | 100 | 84.09 | 87 | 20 | 10 |
| MANDAL | 69.23 | 78.94 | 34.09 | 60.75 | 24.16 | 10 |
| c) Household Management Analysis: |
| Village Name | R = (H*V)/M | ||||||||
| LUMTI | 153.19 | ||||||||
| POTHING | 143.98 | ||||||||
| DHARI | 159.98 | ||||||||
| BARSUNDHI | 174 | ||||||||
| MANDAL | 146.77 | ||||||||
| Village | Pre-Disaster Data | During Disaster Data | Post Disaster Data | ||||||
| Name | (In %) | (In %) | (In %) | ||||||
| Prevention | Preparedness. | Mitigation | Response. | Commu | Rescue & | Damage | Communi | Rehabilitation & | |
| nity | Relief. | Assessme | ty Health | Restructuring | |||||
| Particip | nt | ||||||||
| ation | |||||||||
| LUMTI | 38.94 | 12.76 | 30.30 | 24 | 13 | 41.42 | 29.99 | 33.22 | 22.85 |
| POTHING | 29.46 | 21.27 | 23.74 | 24 | 17 | 59.99 | 56.66 | 33.84 | 21.90 |
| DHARI | 56.83 | 21.27 | 29.99 | 0 | 68 | 35.71 | 100 | 30.76 | 47.61 |
| BARSUNDHI | 24.20 | 4.25 | 37.50 | 0 | 5 | 21.42 | 100 | 12.30 | 19.04 |
| MANDAL | 78.94 | 19.14 | 15.62 | 20 | 80 | 50 | 100 | 32.30 | 42.85 |