1. I. Introduction
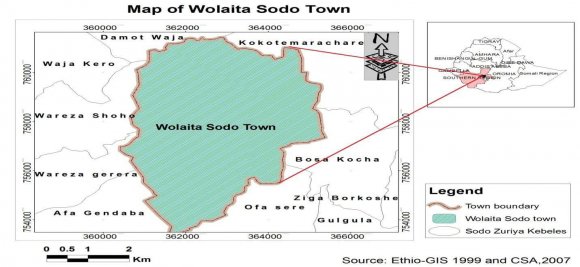
he study area lies in the eastern side of south island of New Zealand, part of a continental fragment that consist the Canterbury plain to the North, Campbell plateau to the Southeast and Chatham rise slightly northeast (Fig. 1). Canterbury basin covers an approximate area of 40,000 km 2 , accumulating sediment since the rifting of the shelf margin from Antarctica in Cretaceous.
This research utilises well data obtained from Integrated Ocean Drilling Program (IODP) expedition 317. The expedition which targeted stratigraphic seismic sequences earlier interpreted from the MCS seismic data acquired on the eastern margin of the south island of New Zealand (offshore Canterbury).
This work aimed to correlates seismic sequences boundaries earlier interpreted by Lu and Fulthorpe (2004) with sedimentary sequence surfaces observed in cores recovered from the four sites drilled across the shelf by expedition 317. From the earlier acquired MCS EW00-01 data, nineteen seismic sequences were interpreted, ranging from Miocene to Recent in age. Such interpretation was based on standard interpretation techniques identifying reflection termination patterns such as onlap, downlap and truncations.
T
17 ( B )Global Journal of Human Social Science
2. a) Stratigraphy / Sedimentation
Sedimentation and stratigraphy of the basin consists traceable records of tectonic activities which created accommodation space for sediments infill. Hence, stratigraphy and sedimentation history would be discussed alongside tectonics. Sedimentation began about 80 Ma ago, before the rifting phase, the basin's variable facies reflect transgressive to regressive cycles with the Onekara, Kekenodon and Otakou Groups being the major packages deposited in various phases of sea level as transgressive, highstand and regressive deposits respectively (Carter and Carter, 1982;Lu and Fulthorpe, 2004).
Deposition of the regionally extensive pelagic to hemipelagic Amuri and weka pass Bioclast limestone Formations collectively called the Kekenodon group, consequently results from reduced terrigeous influx at maximum transgressive phase approximately 30 Ma.
Marshall Paraconformity separates the two formations (Fig. 2C). Marshall paraconformity is confirmed from drill sites to be a regional paraconformity, extending to adjacent basins and throughout the east of the Tasmanian gateway. It is considered to represent the onset of thermohaline circulation from Separation of Australian and Antarctica about 33.7 Ma. The overlying Otakou Group is predominantly terrigenous with little amounts of mudstone and very fine to fine grained sandstone. It is dominated by siltstone and silty mudstone (Carter et al, 2004).
In Late Oligocene to Early Miocene Regression owing to Strike-slip movement that initiated Alpine fault increased rate of sediment supply. Rakaia, Rangitata, Pereora and Waitaki have provenance tied to the Southern Alps. These units are mainly coarse-grained sediments deposited in a river system (Fig. 2) (Lu and Fulthorpe, 2004).
3. II. Data a) 2D Seismic Data
Data available for this project are obtained from the integrated Ocean Drilling Project Expedition 317. However, the two-dimensional high resolution seismic data was acquired by Maurice Ewing in January 2000. The EW00-01 grid lies between the Banks and the Otago peninsulas along the middle to outer shelf and slope offshore in water depth of 40-1100 m (Fig. 3). Source for the seismic acquisition of EW00-01 is two GI air guns (45/45in3). The survey yielded a total of 57 profiles approximately 3250 line-km with approximately 4840 km2 coverage. Spacing of seismic lines perpendicular to the margin is 0.7-3 km in the dip direction while along the strike direction 5.5km parallel to the margin. Vertical resolution is sufficient, within the upper 0.5 s which is approximately 5 m, sufficiently penetrated the Oligocene to Holocene section below the sea floor.
4. b) Well Data
Well data available for this project came from four different sites all within the seismic survey grid EW00-01 (Fig. 3). Sites designated for drilling were planned before the expedition targeting most appropriate trajectories transecting sequence boundaries earlier interpreted from seismic lines. Variable successes were attained in most holes drilled. Site U1351, U1354 and U1353 can be seen on EW00-01-66 seismic profile (Fig. 4B), while site U1352 can only be seen on the seismic profile EW00-01-60 (Fig. 4A). U1351 as well as the other two sites on seismic profile EW00-01-66 are located on continental shelf; U1352 is on the upper slope. Site U1351 is in a water depth of 122 m, three wells were drilled at the site namely; U1351A, 1351B and U1351C, hole U1351B attained maximum penetration depth of 1030.6 m DSF, hole U1351A and U1351C have penetration depths of 28.0 m DSF and 967.3 m DSF respectively. Well U1351C was not cored, it was drilled purposely for wireline logging, 27.3 m and 304.5 m of core were successfully recovered from hole U1351A and U1351B respectively. Four holes were drilled in site U1352. In site U1353, three holes were drilled, two holes cored (U1353A and U1353B).
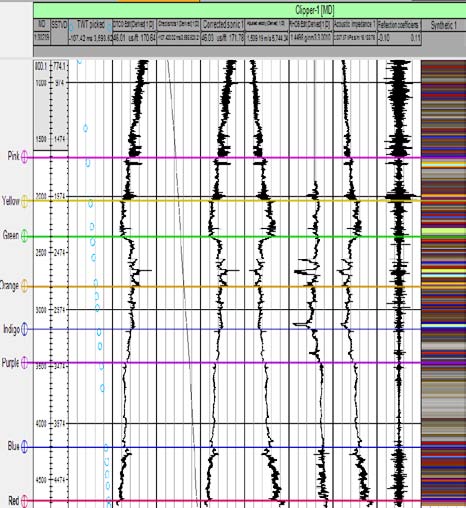
5. III. Methods a) Two-Way Travel Time / Depth Conversion
The seismic data was taken in time, whereas, cores measurement is in meters, hence the need for two-way travel time to depth conservation. Conversion is required to enable correlation of sequences boundaries on actual core surfaces with sequence boundaries interpreted from seismic section. In this project two-way travel time to depth conversion was carried out using complete sonic and density logs available from Clipper-1 well (Fig. 5) which is within the survey area using Schlumberger petrel software 2013 version. This was done by creating a synthetic seismogram; the synthetic seismogram generated was compared with precruise synthetic seismogram from Lu and Fulthorpe (2004). From seismic data (EW00-01) earlier interpreted by Lu and Fulthorpe (2004), nineteen sequence boundaries were identified and interpreted (U1-U19), these boundaries were confirmed to be unconformities surfaces using fossils and carbon dating (Fig. 6). This interpretation was verified and further correlated with their actual depth in the cores provided. The actual sediment lithologic expression of the interpreted sequence boundaries in the cores were studied to determine the facie variation, sedimentary packages and lithologic discontinuity across the boundaries using the provided detailed core descriptions and high resolution core images. Identifying the boundaries based on rock type or lithology, with more emphasis on grain size contrast, nature of contacts, sedimentary packages and variability across the contacts. Emphasis was on the shallow boundaries considering the depth of penetration in the holes which provided the only gateway to the actual nature of sediments seen in cores.
6. IV. Results
Correlation of seismic interpreted sequences boundaries with the actual lithologic expression in cores were possible using seismic interpretation from Lu and Fulthorpe (2004). From the interpretation, nineteen boundaries were identified (U1-U19), these boundaries can be broadly divided into two large units. From U19-U11 (the upper units), it's dominated by downlapped seismic termination pattern along the paleoshelve and truncation surfaces across the shelve edge around site U1351B (Fig. 6), a number of channel incisions were observed in this profile. The lower units (from U10-U5) consist of less truncation but more common onlap on paleoshelves (Fig. 6), it features more drift deposits with sigmoidal reflection pattern.
Only sites U1351B and U1352B have both sonic and density logs hence 7 boundaries (U14-U8) in site U1351B and 7 boundaries (U19-U13) in site U1352B fall within the interval of the created synthetic seismogram. Other sites without synthetic seismogram cannot be correlated with much certainty due to lack of both sonic and density logs. However, for sites U1353 and U1354 two-way travel time picked at such boundaries were used in a function (equation 3) to determine the depth. The function was derived from check-shot data obtained from Clipper-1 well used by expedition 317 scientists (2011). The same classification and names for the different boundaries as Expedition 317 Scientists ( 2011) is adopted for this project with S(no) denoting a lithologic surface and U(no) representing a seismic sequence boundaries.
7. V. Discussion / Conclusion
Cores recovered from four sites at different parts of the shelf to slope (site U1351, U1353 and U1354 at shelf to site U1352 at slope) had further consolidated previous seismic interpretation. Facie assemblages observed across the shelf were divided into units and sub units based on facie variability to facilitate depositional environment interpretation and facies successions during different stages of sea level. At site U1351, upper to middle part of lithostratigraphic unit I (50-150 m CSF) facie assemblages consist of upward fining shelly sandy mud which coarsens upward into sandy mud. The presence of lag deposits above an erosional contact with upward-fining intervals suggests a transgressive system tract which passes into highstand mud deposit above it. Coarsening-upward sandy mud sequences suggests prograding shoreline at low accommodation space (Expedition Scientists, 2011). At site 1352, which is strategically located on the slope slightly different facie assemblages were observed. Divided into three units, unit I which represent series of downlapping reflection termination pattern as interpreted from seismic data, it's consists of few sedimentary structures and is being interpreted as lowstand delta front deposits. Slump deposits observed in the upper part of the unit may suggest deposition during high rate of sediment supply as part of a prodelta environment. Sharp contacts associated with dark gray sand are interpreted as gravity flow deposits part of delta along the slope as mass flow deposit. The calcareous dominated unit II with sandy marlstone and minor sandy mudstone suggest pelagic to hemipelagic deposit. The marlstone is interpreted as drift deposit, calcareous nature of these units suggest condensed section formed during sediment starvation period (Expedition Scientists, 2011). Alternating nature of lightcolored marlstone with dark mudstone and thin sand Unit III is correlated with the regionally extensive Amuri limestone believed to be deposited in an outer shelf to slope setting (Field and Brown, 1989). Multiple lithologic units can be seen in cores which can be easily identified as sequence boundaries existing near the predicted depth, making it difficult to identify the actual sequence boundaries from lithostratigraphic data alone in site U1352. These lithologic units have potentials to provide strong seismic impedance contrast, however, only a single reflector is visible on seismic section and is expected at the predicted depth. Possible explanation to this scenario is that this could be related to the vertical resolution of seismic data from acquisition. The ability of seismic to recognize individual closely spaced events or reflectors is limited to the pulse length; maximum resolution of seismic is from 1/4 to 1/8 of the dominant wavelength of the pulse. Typical vertical resolution for a reflection seismic survey with a dominant frequency of 50 HZ and average sedimentary velocity of 2.0 km/s is 10 m (Sheriff and Geldart, 1983). Hence, most of the reflectors seen and interpreted on seismic are believed to be an order of magnitude larger and stronger than the actual lithologic expression seen in cores.

| Offshore Canterbury Basin | ||||
| Lithologic Surface S1 S2 S3 | Overlying Lithology Clayey Mud Very Fine Sand Mud | Sediment Expression at Contacts Sharp Contact Between Silty and Clayey Mud Sharp Contact, Intercalated in Mud Sharp Contact, Thin Sand with Mud | Sequence Boundaries U19 U18 U17 | Year 2018 |
| S4 S5 | Sandy Mud Medium | Gradational Contact in Shelly Sand Incomplete Core Recovery | U16 U15 | 23 |
| S6 S7 S8 | Very Fine Shelly Sand Muddy Sand Very Fine Muddy Sand | Sharp Contact with Mud Sharp Contact with Clay Beneath Sharp Contact with Basal Silty Mud | U13 U12 U10 | Volume XVIII Issue III Version I |
| ( B ) | ||||
| Global Journal of Human Social Science - | ||||
| © 2018 Global Journals |
| a) Lithologic Expression of Sequence Boundaries at Site U1351 | |||
| b) Lithologic Expression of Sequence Boundaries at Site U1352 | |||
| Lithologic Surface | Overlying Lithology | Sediment Expression at Contacts | Sequence Boundaries |
| S1 | Mud | Sharp Contact with Muddy Sand Beneath | U19 |
| S2 | Muddy Sand | Sharp Bioturbated Basal Contact | U18 |
| S3 | Muddy Sand | Sharp Highly Bioturbated Basal Contact with Mud Beneath | U17 |
| S4 | Muddy Sand | Sharp Bioturbated Basal Contact with Underlying Mud | U16 |
| S5 | Sandy Mud | Sharp Basal Contact Slightly Bioturbated | U15 |
| S6 | Sandy Mud | Sharp Bioturbated Basal Contact | U13 |
| U1352C-S9 | Limestone | Sharp Basal Contact With Marlstone Beneath | U9 |