1. Introduction
he land capability depends on general characteristics with taking into consideration the kind of its use. There have a range of classes' from1 to 8. This classification help us in order to get suitable suit for a crops and unsuitable for another; therefore, land capability is very important in order to get the best productivity of the trees [1]. Suitability of the section of the land affords the production of crops in suitable way this evaluation help to get many opportunities for use of land planning and development [1]. Moreover, these kinds of analysis allows identifying the main limiting factors for agriculture production, and helps the decision makers such as land user, farmers and agricultural support services tp develop a crop managements able to overcome for increasing productivity [1].
According to the different kinds of soil then we get that not all agriculture lands are the same and not all lands are suitable for the same kinds of plants. In a Britch Colombia study they depend on two factors which are climate determining the heat energy and moisture inputs required for agriculture production. Topographic is important for the ability to use cultivation equipment. Although, soil is important key for agriculture, according to upon factors they may be appropriate for sustaining the production of certain agricultural products [2].
So, soil capability for land classification system for agriculture was developed for use across Canada national soil survey committee in cooperation with the federal administration provincial ARDA administrations [3]. Then, they get 8 classes for the soil classifications. [3] Many factors affect the safety and gain of crops worldwide; from the effects like floods, drought, swarms of insects and poor farming techniques. Now a day, solutions are found one of them is using geographic information system because is being able to map and project current and future fluctuations in precipitation, temperature, crops output and more. Then, farmers and scientists can work together to create more effective and efficient farming techniques; this could help in increasing food production in part of the world that are struggling to produce enough for people around them. Although, GIS can analyze soil data combined; to determine what the best crops to plant, and how to maintain soil nutrition levels to best benefit the plants [4].
GIS in agriculture is not a new phenomenon any more. In order to protect the environment and to capable of providing excellent nutrition to the people, then the best choice for achieve that idea is technology and geospatial, which can create a dynamic and competitive agriculture. Although, because of natural inputs in cultivating is uncontrolled, so all data and information can be now understood and managed by GIS application. However, GIS can help in effective crop yield estimation, soil analyses and erosion identification this things can be more accurate and reliable crop estimate help reduce uncertainty [5]. Using sophisticated agriculture technology by the farmers can help them in saving time and money. For example; farmers use precision GPS on the field to save fertilizer. Also, satellites and drones collect the vegetation, topography and weather information from the sky. All of that make geographic information system (GIS), an extremely relevant tool for farmers, so all that data go into agriculture map for better decision maker [6].
Now from GIS we can get a maps and projects that help the farmers to know the annual precipitation, temperature and crops out etc. And also, that helps the farmers to achieve increased production and reduce costs by enabling better management of land resources [5].
Lebanon is one of many counties that have agricultural important sector, according to the rich soil, and moderate climate and abundant water resources provide it, that's why can take Lebanon as an ideal location for agriculture activities [11]. Moreover, Food and Agriculture Organization (FAO) made a study about the agriculture of Lebanon they found that 67% of Lebanese territory is covered by agriculture area, and 14% of the total area of Lebanon is considered arable, besides rainfall which is also an important factor for agriculture it is relatively abundant an average of 2.2 billion m 3 /yr; and this is higher than average, Lebanon is rich with major rivers and water resources [7].
Because of this big conflict that Lebanon suffer from, so we took agriculture land capability as an project in order to start getting a solution for this problem. After that we start search about the most permanent trees cultivated in Lebanon especially in south Lebanon that hold the most variety in permanent trees cultivation, then we took a thirteen kind of permanent trees. Lebanese's agriculture occupies about 47% of permanent trees (fruit trees). Moreover, 28% of citrus trees category, 19% of apple trees, 15% of grape trees and 11% of banana trees [4].
Agriculture land capability with organization is a good solution for environment and for economics issues although forget more productivity. The selection of the best location for every tree should be controlled by several factors and criterion that identify the most suitable places for permanent trees. Several indices were defined to determine suitability factor and sustainable development had an important part in the selection process. This selection is managed by several data being mapped and organized using GIS to get output showing different suitability classes. The process of agriculture land capability selection will be accomplished on South Lebanon that suffered from the unorganized cultivation and low productivity of the planted trees.
2. Study Area
The South Lebanon Governorate spans along the Mediterranean cost, limited by the Nabatieh Governorate to its East and the Mount Lebanon Governorate to its North. The governorate has an average altitude ranging between 0 to 300 meters above sea level, with a few areas reaching 1,500 meters above sea level in the north. It encompasses few mixed rural areas mainly concentrated around its 3 main cities (Jezzine city, Saida city, and Tyr city), with a majority of natural areas, and main agricultural lands. It is crossed by 7 rivers, the Awali, Sayniq, Litani, Zahrani, Naqura, Qasmiye, and Hasbani Rivers.South Lebanon is an important agricultural region, spreading from Sidon to Tyr where intensive agriculture is also present in greenhouses. Greenhouse agriculture in South Lebanon covers an area of 6,277 dounoum (2010), 78% of which is used for the plantation of fruits. Permanent agriculture land covers an area of 201,539 dounoum, 38.9% of which is used for planting olives, and 31.6% used for citrus fruits. The Nabatieh governorate is divided into four districts that are the largest in South Lebanon (Nabatieh, Hasbaya, Bint Jbeil, and Marjeyoun).The governorate is located in the far South of Lebanon, with the Mount of Rihan and Jezine district on its northern border, Litani river valley to the East and South, and the fertile coastal plains to the west. It has a total surface area of 1,058 km² which constitutes 10% of the total Lebanese territory. Nabatieh city, the capital of the governorate, is 22 km away from Saida and 65km from Beirut.
The two districts are suffering from the lack organization of agriculture, like the other districts of Lebanon so we start to find a solution by south Lebanon, because the land in south Lebanon is so fertile and rich in variety in products due to the good characteristics in soil.
3. II.
4. Methodology a) Principle
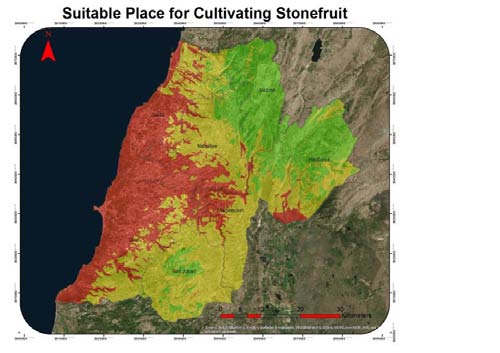
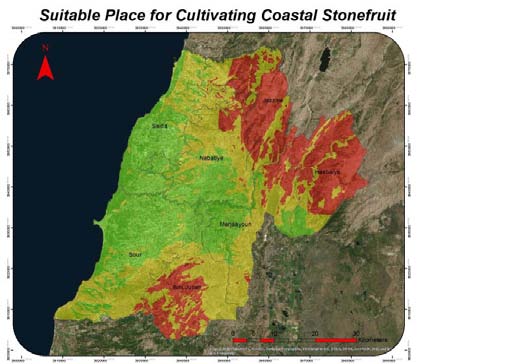
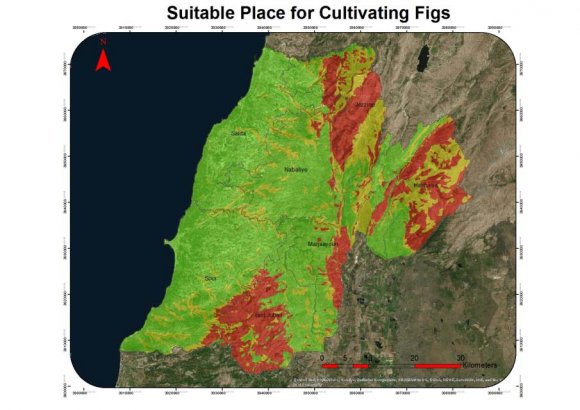
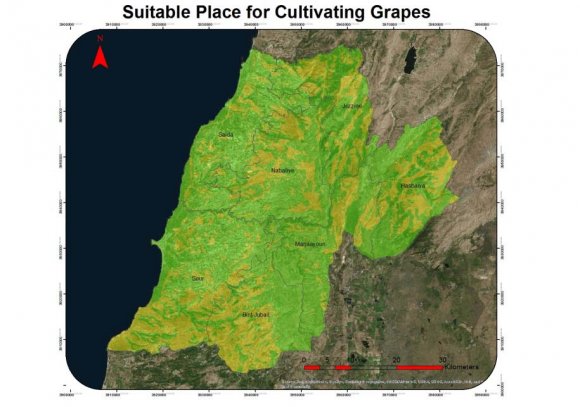
GIS is capable of providing spatial analysis including manipulating and analyzing form maps. Site selection or suitability analysis is a type of analysis used in GIS to determine the best place for a project. The research methodology is based on using different GIS spatial analysis tool with intersections for the polygons in order to get the best location for every tree in the study area. The selection of the best location for the trees has been done by research around the word. Take thirteen kind of permanent trees which are: apple, avocado, stone fruits on the coastal region, and stone fruit on the mountain region, banana, citrus, figs, grape, mango, loquat, pistachio, olive and pomegranate. Moreover, the chosen factors were different depending on the kinds of trees in the study area. Thus, several factors have been first identified, based on the kinds of trees analysis, which defines the five main factors: soil, PH, rainfall, temperature and elevation. These factors are very important for the productivity of the trees. Each factor gas been classified into different classes according to the suitability range. The value 1 was given the most suitable place and different values show suitable and least suitable. Factors of each index were given a same weight. The intersection of these factors it gives the best suitable place for each tree with a single map.
5. b) Data and Methods
The method used is a combination of the data provided by remote sensing space and the tools of the geographic information system (GIS). It can be considered as an effective method that was used by S.Selvametal and Radhakrishnan. D in 2014 in India, and by Hsin-fu Yeh in Taiwan in 2008 [6].
It consists in choosing the factors affecting the procedure of the suitable location for permanent trees in south Lebanon and then establishing the existing relations between them. These factors are: soil, PH, rainfall, temperature and elevation, the relationship between these factors and suitable location for each tree. For each factor we have established a represented map depended on its effect on suitable location.
6. i. Soil
Soil is a natural body comprised of solids (minerals and organic matter), liquid, and gases that occurs on the land surface, occupies space, and is characterized by one or both of the following: horizons, or layers, that are distinguishable from the initial material as a result of additions, losses, transfers, and transformations of energy and matter or the ability to support rooted plants in a natural environment [7]. Besides, the most suitable soil for cultivating should bet one of third of loam, one of third of clay and one of third of sandy. Although; the organic matter shouldn't be less than 3%, and the color of soil is red or black. So in our project we get the best soil type for every kind of permanent trees, according to FAO soil classification for south Lebanon, then we get the result as shown below in a Water is obviously a key factor in plant growth, since the greater the average temperature the greater the amount of water required for plant growth. Besides, seasonal variation is important as different crops require water at different time, then looking for rainfall reliability so that we can select the most appropriate crop for the area [8].So, in Mediterranean; crops growth affected by summer drought despite high annual rainfall, since the rainfall is very high in winter month infiltration rates are comparatively low. From our study we get that annual range of rainfall in south Lebanon is between 500 ml/yr and 1300 ml/yr [9]. iii. PH Soil PH is a measure of the acidity and basicity (alkalinity), is considered a master variable in soil as it affects many chemical processes. It specifically affects plants nutrient availability by controlling the chemical reactions they undergo [10]. However, the optimum PH range for most plants is' between' 5.5 to 7.5, but many plants have adapted to thrive at PH value outside the range [9]. So, the result we get from our project is shown in the
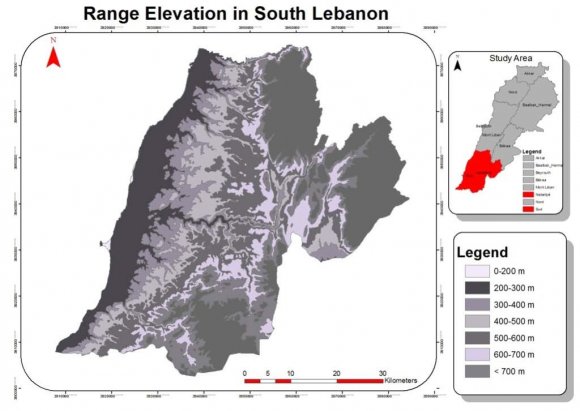
7. v. Elevation
There is a relation between climate and elevation. That's why every type of agriculture has a suitable height from mean sea level, so this elevation is taken into consideration because some types of trees shouldn't hold out a high altitude [10].
8. c) Implementation of simple additive weight method
The simple weight method was used as multi attribute decision technique. A score is calculated for each alternative by multiplying the scaled value given of the alternatives of that attribute with the weights of relative importance directly assigned by decision maker followed by summing of the product for all criteria. The SAW was used in generating each index map taking the weight of each factor with its obtained score from several associated factors, as well as in producing the final map considering the index weight with the obtained score from each index map.
9. S=? W i X i
Eq.(!)
Where; S= Suitability index W i = weight of i th factor X i = score of the i th factor attribute Then, the weighted was assigned in our project is equal, since there is no appropriate or exact value for agriculture, so we use it as 0.2 for all of the factors, in order to get the final map for every tree and get the most suitable location for it.
10. a) Results
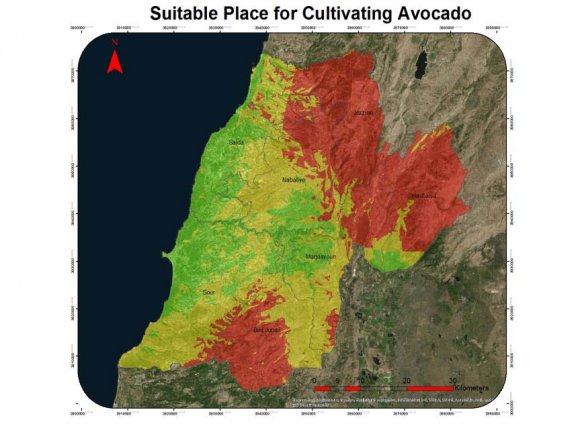
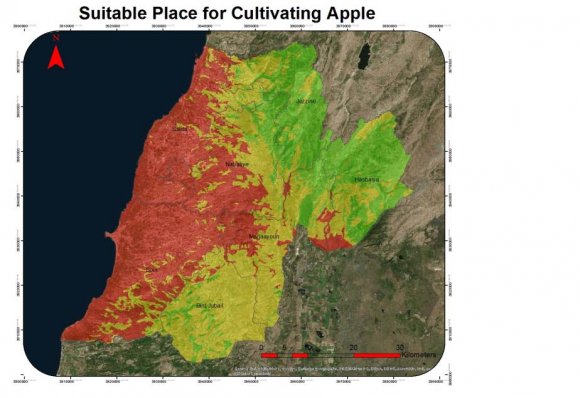
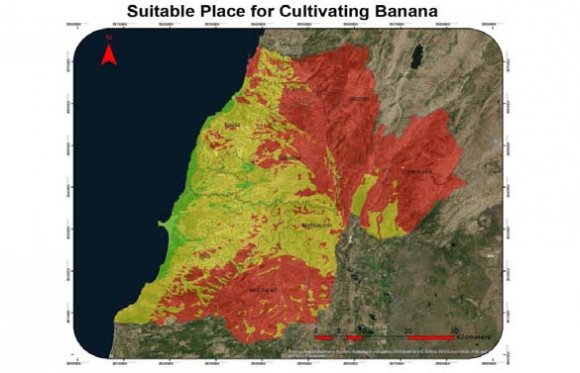
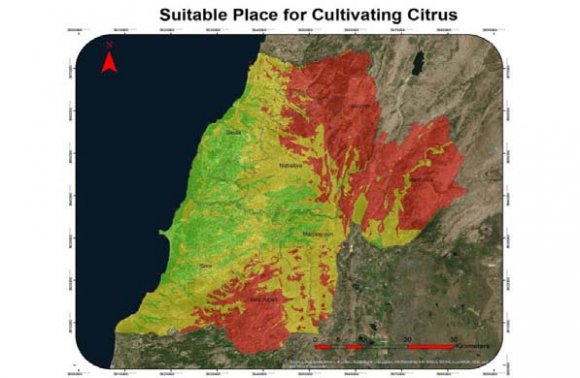
Since many factors are incorporated in the agricultures land capability selection for the best location of permanent trees, GIS is identify this kind of study to accomplished using Arc GIS software. Vector data type was used as a data type for all factors. For each determined factor a map was produced and classified according to suitability classes. Several geoprocessing tools were applied to generating the map representing each factor. A classification was obtained for each map by assigning values from 1 to 3 to its own attribute table according to the suitability classes. The factors maps related to each index were used to produce the index map. After getting five maps for the five factors for every tree we use the intersection tool which helps us to get a final map for every kind of implemented to calculate the suitability index for each produced polygon based on the assigned weight for each factor. The generated index map was classified using the natural break classification; which was found the best suitable location for every permanent trees of area of study; as most suitable (class 1), suitable (class 2) and least suitable (class 3). The procedure was applied for all of the thirteen kind of trees I was shoes them in our study. We are going to present 13 types of trees with their maps after unifying the 5 factors we talked about in chapter 3 and we classified them into 3 classes: first class which is "most suitable" that represent from 1 to 1.4, second class which is "suitable" that represent from 1.4 to 2, third class which is "least suitable" from 2 to 3. The maps for each kind of tree will be shown below: Results and Discussions tree. The simple weighting method was then Volume XVIII Issue IV Version I
The map obtained in figure 4.14 and its classified into 5 classes: first class is "zero" means no trees can cultivated in this place, second class is "one" means only one kind can be cultivated, third class is "between 2 and 4" trees that can be cultivated, fourth class is "between 5 and 7" trees that can cultivated, the last class is "between 8 and 10" trees that can be cultivated.
Figure19: The trees we can cultivate in this place.
From this figure we can see that in the same place we can plant Coastal stone fruit, avocado, citrus, figs, Loquat, grapes, mango, pomegranates, and olives.
V.
11. Discussion
In this project we took South Lebanon as a study area and we chose 13 types of trees to know the suitable location for planting these types to have high productivity.
It is a study to organize the agriculture in Lebanon. We noticed that in South Lebanon 40% of land we can plant from 5 to 7 trees, and 20% of land we can plant from 8 to 10 trees, and 30% we can plant from 2 to 4 trees, and 6% of land we can't plant anything. So I have the choice of planting between 2 and 4 trees, and 5 and 7 trees, and 8 and 10 trees, so we made this Atlas to guide the farmers and people where to plant the type of trees, so they can have high productivity and this Atlas is a beginning in organizing agriculture in Lebanon.
12. VI.
13. Conclusion
To sum up this study, we can conclude that the coastal strip up to an altitude of 300 m is most suitable Then by using "identify tool" in GIS we can get the kind of trees we can plant in its suitable place "1" means found and "0" means cannot be cultivated in this place, like it is shown in figure 4.2 below.
for planting tropical and sub-tropical fruit trees, such as mangoes, bananas as long as the soil cultivated in is high in organic matter and low on clay matter and low Ph, and as for citrus and avocadoes cultivation can be successful up to 600m elevation regardless. Regarding pomegranates, olives, grapes, figs, loquat and stone fruits, we find that they can be cultivated over the entire area regardless of elevation or soil type, except for a few stone fruits varieties like Ajami Apricot which require higher chill requirements and accordingly need to be planted at higher elevations.
Finally, Pomme fruits and Pistachios, since they require high chill requirements to fruit dictates that they be cultivated higher than 700m, with the exception of a few apple varieties like Gala and Anna, which can be cultivated at elevation as low as 250m.
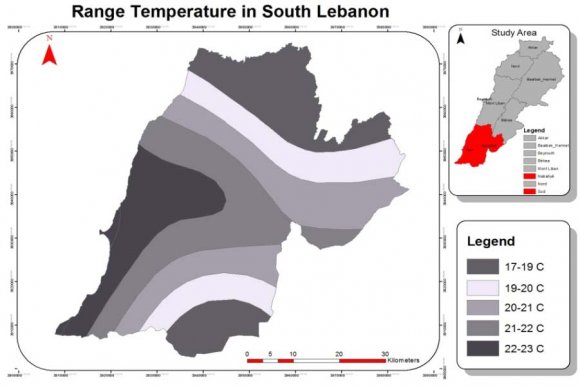
![iv. TemperatureProducing trees are formed scientifically according to the number of hours under 7 0 C. For example; bananas shrubs hold out from 50 to 100 hour only under 7 0 C, and it must not reach 0 0 C, while ajami apricot need more than 500 hour under 7 0 CTemperature ranges in south Lebanon is between '17 0 C and 23 0 C[9].](https://socialscienceresearch.org/index.php/GJHSS/article/download/2634/version/101651/3-GIS-Based-Map-for-Best-Suitable_html/24967/image-2.png)


| Year 2018 |
| 25 |
| Volume XVIII Issue IV Version I |
| ( B ) |
| Global Journal of Human Social Science - |
| Year 2018 |
| 27 |
| Volume XVIII Issue IV Version I |
| ( B ) |
| Global Journal of Human Social Science - |
| 3-below: | ||||
| Kind of trees | Factors | Descriptive Scale | Domain of effect | Index |
| Coastal stone fruits | PH | Most suitable | 5.7-7.7 | 1 |
| Stone fruits | PH | Most suitable | 7.5-8 | 1 |
| Apple | PH | Most suitable | 7.5-8 | 1 |
| Avocado | PH | Most suitable | 5.7-7.7 | 1 |
| Banana | PH | Most suitable | 5.1-7.7 | 1 |
| Pomegranate | PH | Most suitable | 5.7-7.7 | 1 |
| Citrus | PH | Most suitable | 5.1-7.5 | 1 |
| Loquat | PH | Most suitable | 6-7.7 | 1 |
| Figs | PH | Most suitable | 6.8-8.32 | 1 |
| Grapes | PH | Most suitable | 5.7-7.7 | 1 |
| Mango | PH | Most suitable | 5.7-7.7 | 1 |
| Pistachio | PH | Most suitable | 7.5-8 | 1 |
| olives | PH | Most suitable | 6.8-8.32 | 1 |
| Kind of trees | Factors | Descriptive Scale | Domain of effect | Index |
| Coastal stone fruits | Elevation | Most suitable | 0-600 m | 1 |
| Stone fruits | Elevation | Most suitable | 600-3000 m | 1 |
| Apple | Elevation | Most suitable | 600-3000 m | 1 |
| Avocado | Elevation | Most suitable | 0-400 m | 1 |
| Banana | Elevation | Most suitable | 0-200 m | 1 |
| Pomegranate | Elevation | Most suitable | 0-600 m | 1 |
| Citrus | Elevation | Most suitable | 0-400 m | 1 |
| Loquat | Elevation | Most suitable | 0-3000 m | 1 |
| Figs | Elevation | Most suitable | 0-600 m | 1 |
| Grapes | Elevation | Most suitable | 600-3000 m | 1 |
| Mango | Elevation | Most suitable | 0-300 m | 1 |
| Pistachio | Elevation | Most suitable | 600-3000 m | 1 |
| olives | Elevation | Most suitable | 0-600 m | 1 |