1. Introduction
ealth spending in the United States (US) has been steadily rising over the past several decades. According to the US Department of Labor in 2007, 5.8% of Americans' household spending was devoted to healthcare, while in 2015; the number had risen to 8%. Moreover, a recent study conducted by the Brookings Institution (2016) showed that middle-income households currently devote the largest share of their spending to healthcare (8.9%).
As of June of 2016, health spending reached 18.2% of gross domestic product (Altarum Institute, 2016).
Despite these large health expenditure metrics, there were several years of historically low increases in health inflation after the Great Recession of 2007-09 until 2014 and the implementation of the effects of the Patient Protection and Affordable Care Act (ACA). The ACA became law in 2010; however, full implementation of many of the provisions including insurance coverage availability did not occur until January 1, 2014 (Rosenbaum, 2011). The principal intention of the legislation was to provide insurance coverage to millions of US citizens who previously did not possess health insurance to improve Americans' health. This led to the return of increased health spending and the consequent faster growth has been a result of coverage expansions under the Affordable Care Act (Martin, 2016). More specifically, this has been due to increased Medicaid coverage and private health insurance which contributed to an increase in the insured share of the population (Martin, 2016;Collins, 2017). Many studies suggest the increased coverage has improved health and diminished disability (Collins, 2017;D'Angelo, 2015;Brown, 2016).
There was a previous study conducted on the public health system efficiency of European countries (Asandului, 2010). Asandului shows that some of the developed European countries are efficient in output while using their healthcare inputs. Moreover, the study concluded that a dynamic approach using the Malmquist Index could be used to improve their study. To the best of our knowledge, few studies have examined the efficiency of resource utilization of the US health system comparing the 50 states using the Malmquist index. Thus, we published a paper (Putzer, 2016) to compare each state vis-à-vis the other states to examine the efficiency of the use of health resources. This was accomplished through the application of a non-parametric method known as Data Envelope Analysis (DEA). We employed three input variables -the number of physicians per 100,000 residents per state, the number of hospital beds per 1000 inhabitants per state and the public health funding per capita per state and one output variable-disability adjusted life years -to reflect burden of disease. The study considered a multiyear duration from 2008-2014.
In this study, we compare the efficiency of health care resources on a state-by-state population basis in the US between the years of 2008-2015. This includes examining the 50 states through the application of a non-parametric method known as Data Envelope Analysis (DEA). DEA allows multi-input and multi-output analysis. DEA measures productivity efficiencies of Decision Making Units (DMUs). In our paper, DMUs represent the states. DEA creates an efficiency frontier and compares all DMUs against the frontier. In addition, DEA is used to obtain a Malmquist productivity change index, which is a flexible, mathematical programming approach for the assessment of productivity through input and output variables (Roh, 2011).We selected four input variables: insurance coverage of citizens; the number of physicians per 100,000 residents per state, the number of hospital beds per 1000 inhabitants per state, and public health funding per capita per state. We selected one output variable: years of life lost (YLL) to reflect the population burden (Burnet, 2005). Years of life lost are a population-based mortality indicator of the impact of a disease on society (CDC, 1993; Murray, 1996;Murray 2002).The years of life lost metric was developed by the Global Burden of Disease Study (Murray, 1996) to identify the burden of disease and premature death. Burden of disease studies have been implemented using indicators such as the years of lost life (Fontaine, 2003;Burnet, 2005;Kenney, 2008;Putzer, 2015).We conducted analyses to evaluate the differences over 2008-2015 to compare each state vis-àvis the other states to examine the efficiency of the use of health resources on disease burdens.
2. II.
3. Methods
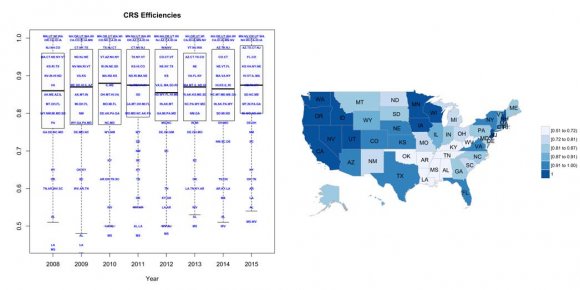
This work approaches the analysis in two steps. The first step is to obtain relative efficiencies for each one of the years included the time-period studied using DEA. The second step is to calculate Malmquist productivity indexes including the Efficiency Change and the Technological Change components. DEA (Charnes, 1978 based on Farrell,1957) is a non-parametric methodology based on linear programming that allows a researcher to benchmark Decision Making Units (DMUs) when transforming inputs into outputs. In our work, DMUs represent US States.DEA uses a set of linear programs that generate a "best practice frontier". The "best practice frontier" is used to determine relative efficiencies for each DMU. Thus, DEA assigns efficiency values of 1 for DMUs in the frontier and lower values regarding other DMUs contingent on their distances from the frontier. In this paper, a Constant Rate of Returns to Scale (CRS) DEA model is used.
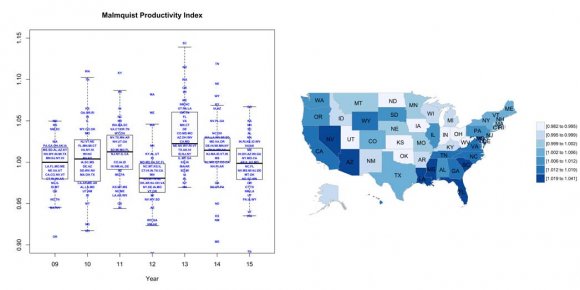
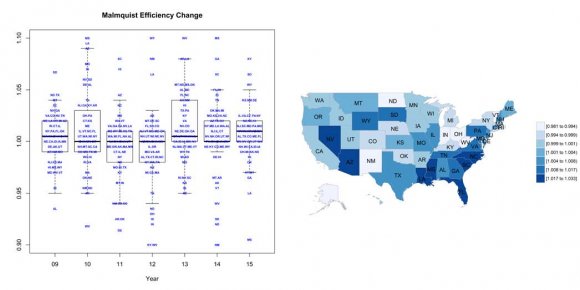
Malmquist Productivity Index (MPI) can be estimated based on distance functions (Caves, 1982). Moreover, it is possible to obtain MPI and its main components, Malmquist Efficiency Change (MEC) and Malmquist Technical Change (MTC), using DEA output oriented models (Fare, 1994). Notice that the decomposition of MPI indicates that DMU growth is due to either a better use of resources (MEC) or due to innovative production technologies (MTC).Malmquist values above 1 indicate efficiency gains while inferior values suggest efficiency losses. For a detailed explanation on the use of DEA and Malmquist Indexes in this context, please refer to Putzer (2016).
4. III.
5. Results
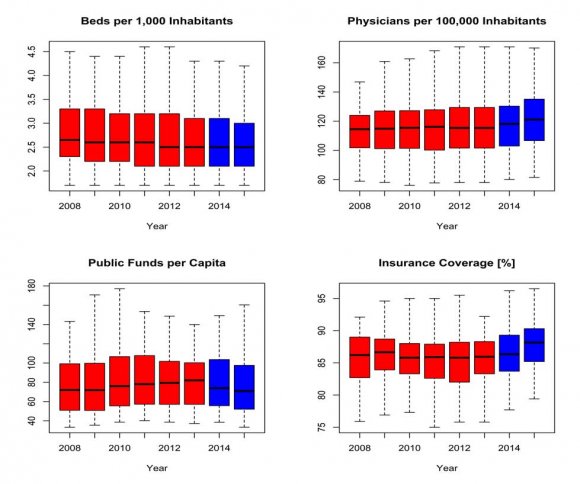
As mentioned previously, this study use four inputs: number of hospital beds per 1,000 inhabitants; number of physicians per 100,000 inhabitants; public health funding per capita (state funds directed to public health and federal funds provided to states by the Centers for Disease Control and Prevention and the Health Resources and Services Administration); and insurance coverage. The output variable is Years of Life Lost. The time-period included in this study is 2008-2015 and DMUs represent states. Data used in this work was obtained from the Kaiser Foundation and America's Health Ranking.
6. Discussion
There have been a few DEA studies to assess the different aspects of the medical field such as hospital efficiency (Tambour, 1997;Zhou 2003;Nedelea 2010;Mecineanu, 2012), public polices efficiency (Coppola 2003;Miller 1996;Sherman, 1984;Rosko, 1984), or health facilities efficiency (Hollingsworth, 2008;Ferrier 2006;Ozcan, 2008).Our recent paper showed the varying levels of efficiency in the utilization of health resources among the 50 US states in affecting the output of disease burden (Putzer, 2016). We identified the most and least efficient states and the states demonstrating the most improvement. In this paper, we introduced a fourth input variable (insurance coverage) along with the previous three input variables (number of physicians, number of hospital beds and public health expenditures) to measure the output variable of disease burden reflected by Years of Life Lost due to Premature Mortality.
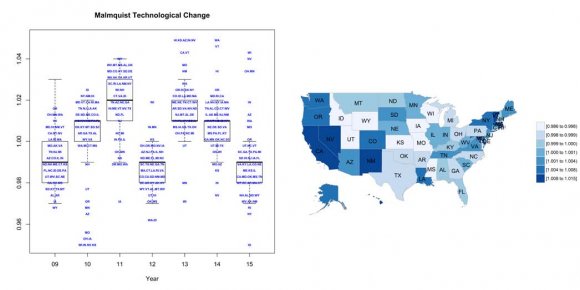
There were some notable changes among the input variables during the study years of 2008-2015. The number of hospital beds diminished during the early years of the study and then were relatively constant over the past four years. The number of physicians remained relatively stable through 2013, followed by an increase thereafter. The public health funding remained relatively constant over the study period. As expected with the full implementation of the ACA, the fourth input variableinsurance coverage-increased appreciably in 2014 and 2015. The output variable -years of life lost -reflecting disease burden was trending downward from 2008-2013 and remained at a new low in 2014-15. The Malmquist Efficiency Index (MEC) was relatively stable during the study period. By contrast, the Malmquist Technology Change Index (MTC) was variable; it increased from 2008-2011; decreased substantially in 2012; increased in 2013; and decreased modestly 2014-15. The Malmquist Productivity Index (MPI) is the product of the MEC and MTC and varied like the MTC. One way to interpret these findings is as follows. More individuals were newly insured and consequently seeking services, but the health infrastructure (i.e., technology) may not have been adequately prepared for the vast increase in newly insured patients seeking health services. The expectation is that these newly insured US citizens would both need and receive significantly more services. Many of the newly insured plausibly accessed the health system for the first time or the first time in quite a while and may have possessed a large number of health morbidities which would impose a further burden on a system in the midst of a significant health policy change.
This study has a few limitations. First, the selection of input and output variables affects the results. Consequently, the research should be extended by incorporating different variables and altering these variables to examine different efficiency outcomes. Second, there are several inherent methodological difficulties in assessing the efficiency of health systems using YLL (Aragon, 2008). A few examples include the fact that YLL does not measure certain conditions effectively such as disabling mental conditions. YLL also does not accurately measure chronic conditions that do not result in death such as osteoporosis.