1. INTRODUCTION
ore than 2.2 billion people of the world are either near or living in poverty. That means around 30 percent of the world's people remain vulnerable to multidimensional poverty which covers lack of the basic necessities such as food, education, health services, fresh water and hygiene which are essential for human continued existence. At the same time, nearly 80 percent of the global population requires comprehensive social protection. About 842 million people of the world suffer from chronic hunger, and nearly half of all workers or more than 1.5 billion are in precarious employment (UNDP, 2014).
According to Damas and Israt (2004), Poverty is generally associated with deprivation of health, education, food, knowledge and the many other things that make the difference between truly living and merely surviving. Another universal aspect of poverty, which makes it principally painful and difficult to escape, is: Vulnerability. Unlike poverty, vulnerability reflects what households or individuals future prospects are and it is an ex ante anticipations of a household or individuals welfare. Thus, the perceptive of the concepts of poverty, vulnerability and their linkage is essential in the efforts to escape from the challenges of impoverishment since vulnerability to poverty is a central manifestation of human deprivations.
Mounting evidences show that households in developing countries particularly poor families are more vulnerable than any other group to health hazards, economic down-turns, natural catastrophes and manmade violence. Poor households are repeatedly hit by severe idiosyncratic shocks such as death, pests or diseases that affect livestock or crops, injury or unemployment shocks and this all affect the wellbeing of these households adversely. For example, WB (2014) indicated that adverse shocks such as illness, injury and loss of livelihood have dreadful impacts, and are significant causes of destitution then this shocks play major role in pushing households below the poverty line and keeping them there.
Several countries, especially in Sub-Saharan Africa, have made poverty reduction and hence improvement in income and welfare their main goals in their growth and development agenda. And most policy interventions adopted by these countries have only focused on poverty at a point in time. For instance, the first MDG only considers the current poor but neglects the future poor or vulnerable (Novignon, 2010).
However, currently non-poor households, who face a high probability of large adverse shock, may experience hardship and become poor tomorrow. Hence, the currently poor households may include some who are only transitorily poor as well as other who will continue to be poor in the future. In other words, a household's observed poverty status is defined in most cases simply by whether or not the household's observed level of consumption expenditure is above or below a pre-selected poverty line is an ex-post measure of a household's well-being. In line with this, Chaudhuri, et.al (2002) noted that for development and policy purposes, what really matters is the ex-ante risk that a household will fall below the poverty line or will continue in poverty. Thus, the current poverty status of a household is not enough and potential for analyzing household's vulnerability of being poor in the future. Moreover, for appropriate forward-looking anti-poverty interventions, the critical need is to go beyond a cataloging of who is currently poor and who is not, to an assessment of households' vulnerability to poverty.
In many developing countries like Ethiopia the principal economic policies have been focused on reducing just the level of poverty which may not be a wholly satisfactory approach to bring sustainable development. However, many development economists suggested that to trace the root factors that will determine destitution needs further investigation on the notion of vulnerability to poverty other than the crude issue of poverty. For example, Amartya Sen portrayed that the challenge of development includes not only the elimination of persistent and endemic deprivation, but also the removal of vulnerability to sudden and severe destitution.
In the view of these facts, the researchers believed that the adoption of innovative and appropriate onward looking anti-poverty perspectives, that is not only improving the well-being of households who are currently poor but also preventing people from becoming poor in the future, is necessary and timely to realize the universal visions of achieving sustainable development passing through poverty alleviation.
Since the detection of vulnerable and poor households together with determinants of vulnerability to poverty is a requirement for triumphant anti-poverty policies, this study, therefore, tried to provide an understanding concerning rural household vulnerability to poverty in Sokoru and Tiro Afeta woreda of south west Ethiopia.
2. II.
3. Materials and Methods
The study of vulnerability to poverty at the household level should ideally be attempted with panel data of sufficient length and richness. However, as a second best alternative to examine household vulnerability to poverty, a cross-sectional household surveys with detailed data on household characteristics, consumption expenditures, asset of household, household access to saving and credit services, shocks experienced by household can potentially be informative about the future in a case where panel data are rare which is the feature of developing countries. Vulnerability measurement assumes general perspectives which include the time prospect and the wellbeing measure. The welfare in vulnerability measurement mostly explained in terms of consumption.
4. a) Description of the Study Area
The Gilgel Gibe project is one of the most attractive potential hydroelectric developments in Ethiopia and it is located 250 Kms Southwest of Addis Ababa and 75 Kms Northeast of Jimma town. The Dam covers an area of 51 square Kms at an altitude of 1670 meters above sea level, and holding around 668 million cubic meter of water. The four woreda bordering the dam are Omonada, Sokoru, Tiru Afeta and Kersa which is majority of the population practice farming as their main means of livelihood (Alemeshet Y. et al, 2011). And this study was conducted in South West of Ethiopia at Gilgel Gibe hydraulic Dam Area of Tiro Afeta and Sokoru woreda, which is found in Jimma Zone of Oromia Regional State. The agro ecology of the study area is entirely midlands or woinadega with undulating and plains topography. Vegetation coverage consists of bush scrubs. The principle crops grown are maize, sorghum, teff and coffee. The largest earning cash crops are maize, coffee and peppers. The main livestock kept are cattle, goats, sheep, donkeys and chickens.
Part of the Jimma Zone, Sokoru woreda has 38 kebeles and among these, 36 kebeles are rural district. The altitude of this woreda ranges from 1160 to 2940 meters above sea level. Persistent rivers include the Gilgel Gibe a tributary of the Gibe and the Kawar. A survey of the land in this woreda shows that 36.6% is arable or cultivable, 16 Although Ethiopia has come a long way in reducing poverty, widespread poverty and food insecurity still persist. The country is prone to drought, which has serious implications on vulnerability and food security as most of the agriculture is dependent on rain. More importantly, structural factors such as land degradation, population pressure, undeveloped farm technology, low levels of household assets and limited opportunities to diversify income make millions of Ethiopians vulnerable to poverty (WFP, 2014). Likewise, Alemayehu and Addis (2014) pointed out that the Ethiopian economy and the country's poor are extremely vulnerable to shocks, which may include conflict, rainfall variability or drought, world price fluctuations of coffee and fuel as well as change in aid and remittances. Hence, the chances of slipping back into poverty both in rural and urban areas following shocks such as drought or the death of the head of the household are very high.
Tiro Afeta woreda has 27 rural kebeles among 32 districts as one woreda in Jimma Zone of the Oromia Region State. The altitude of this woreda ranges from 1640 to 2800 meters above sea level. Persistent rivers include the Gilgel Gibe, the Busa, the Nedi and the Aleltu. A survey of the land in this woreda indicates that 26% is arable, 8.3% pasture, 14% forest, and the remaining 51.7% is considered built-up, degraded or otherwise unusable (OLZR, 2007).
These two woredas are principally affected by chronic threats such as trypanosomiasis, blackleg and stalk borer which harms cattle and crops. Additionally, periodic crop pests like stalk borer and cattle diseases such as trypanosomiasis and blackleg affect these two woreda every 2-3 years (OLZR, 2007).
5. b) Source and Type of Data
Primary sources of data were the most beneficial instruments for the researchers since the study was focused on the micro-level context of a country. Households are the major units of analysis. Multipurpose and Structured questionnaires were used to collect information on household demographic compositions, consumption expenditure, physical capital variables of household including livestock holding and grown crop types, human capital variables, household access to saving and credit services, shocks that the household faced. The data collection process held through a personal interview with the rural households. The data was collected by trained high school completed persons who have experience and knowledge about the culture, language and ethics of the study areas' society. The data collectors trained for two days and principal investigators strictly supervised data enumerators and checked the completeness of the questionnaire. The study also included essential secondary data from responsive office of Jimma zone planning and program office.
6. c) Sampling Procedures
To meet the overall objective of the study and because of lack of prior information on the vulnerability to poverty status of households in Sokoru and Tiro Afeta woreda, the target populations were households whose conditions suggest that they could be poor in the future even if they are above the poverty line today. Sokoru and Tiro Afeta woreda were selected purposively from Jimma zone of south west Ethiopia. Because these selected woreda are represented by a dominantly subsistence farming community where high land degradation, soil erosion and drought problems pose a serious threat on households' wellbeing (Amsalu and Wondimu, 2014).
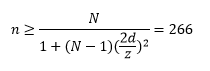
To select the appropriate sample size needed from a total of 55679 rural households in Sokoru and Tiro Afeta woreda, the following sample size determination formula (Noel, et al., 2012) The margin of error d is taken as percent point error term and is often calculated for d=1%, d=2%, d=5% and d=6%. Marginal error of 0.06 is tolerable with 95% confidence interval.
7. d) Methods of Data Analysis
The study utilized descriptive tools as well as econometric models of data analysis. Using Stata13.0 software, the data analyzed via applying a three-stage feasible generalized least squares (3FGLS) technique to identify the extent of rural household vulnerability to poverty and to describe disseminations of poverty and vulnerability to poverty in the study area. And logistic regression method was employed to assess the determinants of rural household vulnerability to poverty in the study area.
8. e) Specification of the Consumption Process
In the most developing countries, consumption rather than income approach is preferred as a measure of welfare indicators. Because in consumption approach, current consumption provides information about incomes at past or future dates that makes it a good indicator of long-term average well-being. It is regular that consumption fluctuates less than income, due to households or individuals smoothing their consumption. Households' not only financed their current consumption but also they responds to fluctuation in income by saving in the boom periods and dis-saving during lean periods in order to smooth their consumption. Lastly but not the least, consumption contains smaller measurement error as compared to income; there is a belief that households are more willing to reveal their consumption behavior than they are willing to reveal their income (Lipton et al, 1993). Consumption reflects the ability of household's access to credit and saving at times when their income is very low. Hence, consumption reflects the actual standard of living than other relative proxies for measuring household wellbeing.
For this study purpose, consumption was adjusted for difference in the calorie requirement of different household members (for age and gender of adult members). This adjustment is made by dividing household consumption expenditure by an adult equivalent scale that depends on the nutritional requirement of each family member. Therefore, throughout this paper, consumption expenditure per adult equivalent per month is used as the measure of household welfare. Chaudhuri (2003) defined vulnerability to poverty as a forward looking or ex ante measure of household well-being and he articulated that the level of vulnerability to poverty at time t is defined in terms of household consumption scenario at some point in time t+1 to distinguish the notion of vulnerability to poverty and poverty. These concepts of vulnerability to poverty indicate the possibility of examination of household vulnerability to poverty without direct reference to the current poverty incidence.
Since the study of household's vulnerability to poverty is principally determined via applying inferences from the future consumption prospects, measuring vulnerability to poverty from cross section data requires a number of factors include: household demographic compositions, consumption expenditure, physical capital variables, human capital variables, household access to socio-economic services and shocks that the household faced, etc.
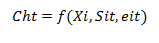
Conceptually, the following reduced form of the future consumption prospect shows the specification of consumption process.
study followed an approach developed by Chaudhuri et al (2002).This method is commonly used in a number of developing country contexts when only cross-sectional data are accessible.
As outlined by Lachlan (2011), estimating vulnerability as the probability of experiencing future poverty reflects three main advantages. Firstly, it produces results that are corresponding to more established poverty measures. Secondly, it sheds light on the connection between vulnerable and poor households; by expressing vulnerability in terms of the probability of being poor. Thirdly, this approach is applicable when only cross-sectional data are available.
Following Chaudhuri et al. (2002), measure of vulnerability as expected poverty is the probability of household, h finding itself to be consumption poor at time t+j can be expressed as :
Where, Vht represents vulnerability of household at time t, lnCh measures household's per adult equivalent consumption expenditure at time t+j and Z is poverty line of household consumption.
The possibility that a household will find itself poor in the future depends on its expected or mean consumption and variance of its consumption stream. And a household's vulnerability to poverty defined as a probability condition representing its inability to attain a certain minimum level of consumption in the future. Therefore, household expected consumption and the variance of its consumption are required to quantify the level of household's vulnerability to poverty
The consumption generating process can be specified as;
Where, Ch is a log normally distributed per adult equivalent consumption expenditure, Xh is represents a bundle of household characteristics, observed experiences of shocks and other covariates, and ? is the K×1 vector of parameters of interest and eh is F×1 vector of unobservable or error term. This error term is a mean zero disturbance term have that captured unobservable household characteristics and idiosyncratic shocks, and covariate shocks that would have contributed to different per capita consumption expenditures of households and assumed to be normally distributed.
9. f) Econometric Techniques
There are three main approaches in measuring vulnerability include; measuring vulnerability as expected poverty (VEP), vulnerability as low expected utility (VEU) and finally vulnerability as uninsured exposure to risk (VER).
For the purpose of this study, vulnerability is defined as expected poverty (VEP) which has measurement advantage for ex-ante information that measures vulnerability to poverty using cross sectional data. Also this method has an advantage on identifying households at risk who are not poor that can be estimated with a single cross sectional data. This approach is adopted by different researchers including ?????? represents observed locally idiosyncratic shocks experienced by household between t-1 and t.?????? t is error term and represents unobservable household and community characteristics, as well as unobserved idiosyncratic shocks and covariate shocks that contribute to differential welfare outcomes of otherwise observationally equivalent households.
extent of rural household vulnerability to poverty, this from a single cross sectional data. To estimate the ???? is a vector of household characteristics
????? = ???? ???????? < ?????? ??? ?(1)??????? = ????? + ???(2)By and large, there is high possibility consumption volatility among the poor households. Thus, Chaudhuri (2003) assumed that the variance of the disturbance term is not identically distributed across a household which rather depends upon some observable household characteristics. And this notion raises the prospect of formulating heteroscedasticity. Hence, the following (equation ( 3)) implies the functional form of heteroscedasticity via applying the variance of eh. The variance of eh is assumed to be represented by:
?? 2 ??? = ?????(3)In case of mean zero disturbance term ,, which is heteroscedastic, using standard regression techniques can yield estimates that are inefficient. Therefore, a three-stage Feasible Generalized Least Squares (FGLS) procedure as suggested by Amemiya (1977) is used to estimate ? and ?.
According to FGLS procedure, equation ( 2) is first estimated using the Ordinary Least Squares (OLS) procedure. Then the OLS estimation of residuals from equation ( 2) is used to determine the following OLS estimation of the residuals:
ê 2 ??????, ? = ????? + ???(4)The predicted values from this supplementary regression ????? are then used to transform equation ( 4) into:
ê 2 ?????? ,? ????? ? ?????? = ? ??? ????? ? ?????? ? ?? + ?? ? ????? ? ?????? ? ????? ? ???????? + ????(5)????? ? ???????? is a consistent estimate of the variance component from equation ( 3),and this transformed equation is again estimated using OLS, and the estimated coefficients from equation ( 5) are the asymptotically efficient FGLS estimator of the variance of household consumption. Subsequently the estimate from the variance can be modified as:
?? ???, ? = ? ????? ? ????????(6)Then this estimated variance ????? ? ????????can be used to transform equation (2) into:
?????? ? ? ????? ? ???????? = ? ??? ? ????? ? ???????? ? ?? + ??? ? ????? ? ???????? (7)OLS estimation of equation ( 7) leads to a consistent and efficient estimate of ?.Then after using the estimates of that acquired from equation (7), it is possible to determine expected log consumption and variance of log consumption for each household. The expected log consumption:
?? ? [(???????/???)] = ????? ?The variance of log consumption:
?????? ? [???????/???] = ?? ? 2 ??, ? = ????? ?And the log normally distributed consumption is an estimate of the probability a household to either be poor or not known as vulnerability as expected poverty is specified by:
?? ? ? = ?? ? ?????? ?????????????? ? ? ????? ? ???????? ?(10)??(. ) reflects the cumulative normal distribution function, Z represents the poverty line, ????????????? ? is the expected mean of real household consumption, and ????? ? ???????? is the estimated variance in consumption. Consequently, the measure of household vulnerability as expected poverty depends on the choice of poverty line, the expected level of consumption and the expected variability of consumption.
Besides, for investigating the determinants of household vulnerability to poverty by using vulnerability to poverty index from the data of monthly per adult equivalent consumption expenditures, this study applied binomial logistic regression scheme. When the vulnerability to poverty index is greater or equal to 0.5, the household is clustered as vulnerable group which takes the value of 1 and 0 otherwise (when the vulnerability index is less than 0.5). Hence, the following model is presented to examine the determinants of vulnerability to poverty of each household as expected poverty (VEP) in the study area.
??? = ????? + ??? (11) = ?? ?????????????????Where Vh is vulnerability to poverty, µ is a Lx1 vector of unknown parameters, Xh is 1xL vector of explanatory variables, and ??? are models residuals.
10. III.
11. Result and Discussion
12. a) Determination of a Poverty Line in the Study Area
According to the WB (2000),the most widely used method of estimating poverty line is the cost of basic needs (CBN) method because the indicators will be more representative and the threshold will be consistent with real expenditure across time, space and groups.
In the CBN approach, first the food poverty line is defined by choosing a bundle of food typically consumed by the poor. In the case of food poverty line, most practices use the nutritional level of 2200 kilocalories to provide an objective standard for what is considered a minimum. A non-food poverty line is determined by tolerating the necessary allowance for the basic non-food items like clothes and shoes, cooking materials and lighting, household durables, cleaning and personal care items, educational expenses, medical expenses, transportation expenses, etc.
In Ethiopia total poverty line used since 2010/2011 is 3,781 ETB per adult person per year expressed in terms of national average prices. And this poverty line is conducted in the context of the 1995/96 poverty analysis report which based on the cost of 2,200 kcal per day per adult food consumption with an allowance for essential non-food items. The food and total poverty lines used since 1995/96 in the country are Total poverty refers to a combination of both the food and non-food requirements. To conduct a representative vulnerability study centered on per adult consumption expenditure, the total poverty line of 3,781 ETB per adult person per year used since 2010/2011 is updated at national average prices for the year 2014/2015. Thus, the updated total poverty line used in this thesis is 429 ETB per adult person per month.
13. b) The Choice of Vulnerability Threshold
The choice of a vulnerability threshold and time horizon is rather arbitrary in the study of vulnerability to poverty providing indication that there is no obvious choice. Most of the empirical studies like (Pritchett, Suryahadi et al. 2000;Chaudhuri, Jalan et al. 2002; Zhang and Wan 2008) adopted the vulnerability threshold of 0.5 and it is the most preferred susceptibility verge. According to Suryahadi and Sumarto (2003), the choice of 0.5 is justified for three reasons. Firstly, it makes instinctive sense to say a household is 'vulnerable' if it faces a 50 percent or higher prospect of falling into poverty in the near future. Secondly, this is the point where the expected consumption coincides with the poverty line. Thirdly, if a household is just at the poverty line and faces a mean zero shock, then this household has a one period ahead vulnerability of 0.5. This implies that as the time horizon goes to zero, then being 'currently in poverty' and being 'currently vulnerable to poverty' coincide (Pritchett et al., 2000).
Thus, this study employed a VEP threshold of 0.5 and time horizon of one year which can indicate the likelihood of poverty in the short run. Appropriate VEP threshold of 0.5 and higher considered as a reasonable threshold to regard one household vulnerable to poverty.
14. c) The Extent of Rural Household Vulnerability to Poverty
The choice of a vulnerability threshold, that is, a minimum level of vulnerability above which all households are defined to be vulnerable and time horizon are necessary elements in the assessment of household vulnerability to poverty status. And these decisions involve certain degree of arbitrariness. To investigate the distribution of household vulnerability to poverty, following Chaudhuri (2003), this paper adopted a vulnerability threshold of 0.5 which is the most preferred vulnerability verge and a time horizon of one year. Households are then considered to be vulnerable if they have a 0.5 or higher probability of falling into poverty at least once in the next year and households with vulnerability index less than 0.5 are grouped as non-vulnerable group. Applying three stage FGLS regression method specified in the methodology part of this paper, an index of household vulnerability to poverty is generated for each household in Sokoru and Tiro Afeta woreda of south west Ethiopia. A total of 139 (52.25 %) households were vulnerable to poverty among the sampled households, using the total poverty line of 429 ETB per adult person per month.
15. Source: compute from own survey, 2015 d) Decomposition of Household Poverty and Vulnerability to Poverty Status
Head count poverty index is calculated applying the total poverty line of 429 ETB per adult person per month. Based on the data used for this study, 48.2 % of households in Sokoru and Tiro Afeta woreda were poor. estimates of poverty, which connote the importance of forward looking poverty analysis. Table 2 shows that a sizable fraction of nonpoor households (51.3%) are vulnerable to poverty and 53.2 percent of the poor households have a vulnerability index greater or equal to 0.5 or have a probability of 50 percent and above to fall in to poverty in the near future. Thus, poverty reduction strategies need to incorporate not just alleviation efforts but also prevention campaigns. It can be seen that, in this case, the poverty rate overestimates the fraction of the population vulnerable to poverty. //** and *** refers to Significant at 5% and 1% Significant level respectively.
16. Vulnerability to Poverty Status of Households
Source: Compute from own survey, 2015 The results of the above regression analysis show that the coefficient of the age of household head is statistically significantly at 1 % and positively related to household's vulnerability to poverty. And this implies that the likelihood of a household's becoming vulnerable to poverty increases with an increase in the age of the household head. This could be because of the fact that as household heads get aged, more probably they become economically inactive which in turn affects their productivity and consequently increase their vulnerability. Thus, the extent to which households manage to escape poverty which is headed by aged person would usually depend on changes in important conditions of the household.
It is evident from the results that household access to credit and saving service is a key determinant of vulnerability to poverty. The coefficient of credit and saving service availability is statistically significantly at 5 % and negatively related to vulnerability to poverty. This implies that households with access to credit and saving services are less likely to be vulnerable to poverty. Increased access to credit and saving services 1993). Iddir is an association made up by a group of persons united by ties of family and friendship and has an object of providing mutual aid and financial assistance in certain circumstances. Number of crops grown and household livestock holding variables appear to have significant and positive effect on household's wellbeing and it reflects that households with diversified crop and enhanced livestock are less likely to be vulnerable to poverty. Possession of a larger number of livestock is one of the determining factors on smoothing consumption and provision of investment since livestock asset is easily and possibly convert to monetary value to positively affect the welfare of households and hence cope up negative shock. This variable affects vulnerability to poverty positively at a 5 % level of significance.
Crop diversification determines households' vulnerability to poverty negatively at 5 % significant level. Crop diversification spreads risks of crop failure and creates opportunities to use different soil conditions to their best advantage, hence lower level of susceptibility to poverty. Generally, in Sokoru and Tiro Afeta woreda of south west Ethiopia, livestock holding and crop diversification play a great role on the livelihood of households falling into poverty trap at least for one more year.
The other important variable is household exposure to idiosyncratic shocks. The coefficient of household exposure to household level shock is statistically significantly at 1 % and positively related to household's vulnerability to poverty. This indicates that households exposed to idiosyncratic shock such as illness, job loss, disability, unemployment, crop pest and diseases are vulnerable to becoming poor. This is due to the fact that these unexpected events will erode the households' economic stand and deplete its assets. This result is largely in line with the findings of Morduch (1994).
However, the regression results revealed that dependence ratio and household head education variables are found statically insignificant in determining vulnerability to poverty status of rural households in Sokoru and Tiro Afeta woreda of south west Ethiopia. Dependence ratio and household head education could be significant variables in the determinations of rural household vulnerability to poverty if extensive research is undertaken based on Panel data. This is due to the fact that many researchers (Adepoju et.al, 2012;Oni and Yesuf, 2006;Shafiul, 2011, etc) in their panel data studies found dependency ratio and household head education variables noteworthy in the determination of rural household vulnerability to poverty.
17. IV. Conclusion and Recommendation
This study estimated vulnerability to poverty of rural households using three stage FGLS procedures and found out that about 52 % of rural households in the study area are vulnerable to poverty which exceed the number of households currently poor (48.2%). It further indicates that a large number of rural households (51.3 %),out of the total sampled non-poor households, are vulnerable to poverty and also 53.2 percent of the poor households are susceptible to poverty again, signifying the importance of forward looking poverty analysis and calls for action oriented policy interventions that reduce vulnerability to poverty.
Therefore, to bring sustained poverty reduction, poverty diminution strategies should focus not only on the current poor households but also on the other part of the population who are currently not poor but are likely to be poor in the future at the time of application of the programme or policies. For example, combinations of strategies like prevention, protection and promotion presumably benefits both poor and non-poor but vulnerable household which would give them a more secure base to diversify their production and consumption activities and decisions. And this is worth full and imperative for policy makers to conscious this fact when designing social policy.
The findings presented in this study indicated that households headed by aged person are more vulnerable to poverty, whereas a household head at more productive age is better dignified to cope up with risk and uncertainty and therefore less vulnerable to poverty. Consequently, investment in human capital along with other means of social protection and promotion such as old age grants could be instrumental for reducing household vulnerability to poverty.
Cognizant of the fact that idiosyncratic shocks determines rural household's vulnerability to poverty significantly through affecting rural household's consumption and productions choices, it is important to assess ex-ante coping strategies that could reduce the exposure of households to various types of idiosyncratic shocks that lead to a reduction in their wellbeing. Developing formal credit and saving institutions and informal protection mechanisms like Iddir and Iqqub is essential scheme for improving household's ability on mitigating the adverse effects of idiosyncratic shocks. As well through improving the ex post coping mechanisms of the vulnerable households, it is possible to lessen the impact of susceptibility to poverty. In line with this, puts ahead the importance of social protection and promotion programmes is indispensable for ensuring inclusiveness in the poverty reduction process so that growth becomes more pro-poor.
On the other hand, factors like livestock holding and crop diversification found negatively correlated with the household's vulnerability to poverty at 5 % significant level. As a result, this is an insight that strong efforts should be made to improve rural household's welfare and reduces vulnerability to poverty through expanding and providing effective credit and agricultural extension services in the study area to have productive livestock species and diversified crops.
Furthermore, access to saving and credit services significantly affect household's vulnerability to poverty with the expected signs. Hence, providing and expanding rural saving and credits services with the necessary awareness creation campaign among the rural households in the study district should be one of the main areas of intervention and policy options. Access to credit and saving services help households particularly in rural area for smoothing income and consumption at the time of man-made or natural catastrophes like disputes and drought.
To sum up, a meaningful and a comprehensive suite of practical strategies that consider poor and non poor vulnerable households is needed to free poor and vulnerable households out of poverty circle and sustain pro-poor growth.
IV.
| Percent |
| Explanatory variables | Coefficients | Std. Err | Z | P>|z| | [95% Conf. Interval] | |||||
| Age of Household Head | 5.144811 *** | .5862036 | 8.78 | 0.000 | 3.995873 | 6.293749 | ||||
| Education | level | of | -.104368 | .3570761 | -0.29 | 0.770 | -.8042243 | .5954883 | ||
| Household Head | ||||||||||
| Crop Diversification | -.5320439 ** | .2561909 | -2.08 | 0.038 | -.029919 | 1.034169 | ||||
| Livestock Holding | -.8988228 ** | .4433819 | -2.03 | 0.043 | -.0298104 | 1.767835 | ||||
| Household Access to | -1.240565** | .4865841 | -2.55 | 0.011 | -2.194253 | -.286878 | ||||
| Credit | and | Saving | ||||||||
| Service | ||||||||||
| Dependency Ratio | -.4051436 | .4275671 | -0.95 | 0.343 | -1.24316 | .4328725 | ||||
| 1.470935*** | .4966894 | 2.96 | 0.003 | .4974412 | 2.444428 | |||||
| Exposure to Idiosyncratic | ||||||||||
| Shock Index | ||||||||||
| _cons | -9.139825*** | 1.796011 | -5.09 | 0.000 | -12.65994 | -5.619707 | ||||
| Log likelihood | = -82.061822 | |||||||||
| Number of obs= | 260 | |||||||||
| LR chi2(7) | = | 196.30 | Pseudo R2 | = 0.5446 | ||||||
| Prob > chi2 | = | 0.0000 | ||||||||
| enhances household's wellbeing through provision of | |
| investment and consumption credit and saving services | |
| to even household's consumption as well as to boost | |
| their income. This result is consistent with the finding of | |
| (Hashemi et al, 1996; Baiyegunhi, 2010). Even formal | |
| financial institutions and micro-enterprises are scant in | |
| the study area, local savings and credit associations | |
| such as Iqqub and Iddirare playing a great role in | |
| smoothing consumption and investment. Iqqub and | |
| Iddir institution are almost ubiquitous throughout | |
| Ethiopia particularly in rural areas regarding their roles in | |
| saving purpose and coping mechanisms during shocks | |
| Year 2016 | at village level. Iqqub is a system of saving where by people form groups and pay periodically a fixed amount of money and it can be formed for various purposes such as; starting or expanding business ventures, |
| 52 | consumption purposes that need expending large sum of money at one time or simply for saving (Dejene, |
| Volume XVI Issue III Version I | |
| E ) | |
| ( | |
| Global Journal of Human Social Science - |