1. Introduction
emote sensing' refers as detection of electromagnetic energy from aircraft or satellites, which was reflected back from earth surface and entities on earth. Remote sensing Data are often distributed in a matrix of square picture elements called pixels (Turner et al, 2003). Remote sensing is the technique of deriving information about objects on the surface of the earth without physically coming into contact with them. This process involves making observations using sensors (cameras, scanners, radiometer, radar etc.) mounted on platforms like aircraft and satellites (Lillesand & Kiefer, 1987). Measurement of reflected energy under visible, near-and middleinfrared, and thermal-infrared range of electromagnetic radiation is commonly used for land-use land cover monitoring via passive remote sensing technique (Turner et al, 2003). Satellite remote sensing found to be useful in estimating the diversity, richness and extent of land cover throughout the different landscapes, meeting a fundamental need that is common to many ecological applications . Satellite imageries obtained from various satellites are increasingly being used for various purposes including land use mapping, change detection and other geographic information system (lee, 1991). Geospatial information about land-use land cover and its patterns having important applicability for development and conservation planning/management. Data for Landcover and land-use are necessary for various different purposes like environmental monitoring, change detection, as well as development schemes Harborne, 1999 andEdwards, 2002).
Snow bound mountains are sensitive to climate and also act as best indicators for change. Therefore, monitoring of these mountains thus subject to monitoring of environmental and climate changes (Oerlemans, 1994). Information about changes or change detection on the earth's surface is becoming more and more important in monitoring of resources and environment at the local, regional as well as global scale. Remote sensing techniques are best suited and easily applicable way to analyze and to monitor these remote snow bound mountains (Bolch & Kamp, 2008). The easily availability of remote sensing imagery of present as well as past makes it possible to analyze spatio-temporal pattern of environmental elements, changes throughout the time interval and impact of human activities in past decades (Jianyaa et al, 2008). Change detection plays a very important role for development, conservation, economic construction and national defense as well. Change detection and its accuracy is a main issue for resource and environmental monitoring, disaster monitoring, city expansion, geographic information update and military defense (Li, 2010).
Accurate and timely information about land use and land coverof a landscape or landforms and its changes over the time plays a crucial role for land management, decision-making, ecosystem monitoring, conservation, urban planningand development (Zhou et. information it receives into knowledge and the type that is not (Dretske, 1981). There are surprising number of things that we cannot know (or questions we cannot answer) that are not the result of imperfect information. Forms of not knowing are pervasive in domains as diverse as mathematics, logic, physics, and linguistics, and are apparently irreducible (Couclelis, 2003). In applications of GIS and other geo-spatial technologies, being right (accurate, correct, precise) is considered of paramount importance and may be sometimes mean the difference between life and death (Couclelis, 1992).
Error associated with data acquisition, processing, analysis and interpretation can have significant impact on management planning and conservation efforts (lunette et al 1991). Although the use of advance techniques is increasing rapidly our understanding about data processing, integration and especially result interpretation, leg far behind. Performing geospatial operations using satellite imageries especially in high mountain regions with low accuracy and narrow range of operations without actual verification will produce product of low confidence (Veregin, 1989). Therefore, it must be needed to clearly identify the types of errors that may occur, proper understand of concepts and how these errors propagate and how to remove them or avoid them (Marin,1989). Main objective of this article is to highlighting one of the basic conceptual errors occurring during use of remotely sensed imaginary for high mountain regions studies and its resolution.
2. a) Background
Snow bound mountains and their surrounding regions like Nanda Devi National Park in India is best areas to study the climate change impact on glaciers and its outcomes on life forms (Bolch, 2006, Gong, 2008 andOerlemans, 1994). Without using advance geospatial techniques like remote sensing and GIS Studying such rough terrain is not an easy task . Easily availability of remotely sensed imagery for high range of temporal resolution make it easier to analyze change over the time period (Rees, 2002). But due to seasonal variation within year time framework, it is more important to understand and carefully selection of imagery and operations should be clearly analyzed and verified. A negligible error in selection without verifications make it possible to misinterpret the findings. This paper focused upon misinterpretation often occurs in the geospatial domain by shifting the focus from observations to information, as well as on the schemes applicable for validation of results.
3. II.
4. Material and Methods
Satellite remote sensing had been used for meeting a fundamental need that is common to many geospatial applications (Lu et al., 2004 Lands at remote sensing datasets were acquired with initial geo-rectification completed. After acquiring the satellite images of the study areas Atmospheric and radiometric corrections (Leonardo et al. 2006) was performed where ever needed. And then False Color Composite (FCC) map was developed using layer stack function in EARDAS Imagine software by taking four band Red (wave length of 0.636-0.673), Blue (wave length of 0.412-0.512), Green (wave length of 0.533-0.590) and Infrared (wave length of 0.851-0.876) each with spatial resolution of 30m and radiometric resolution of 8 bit and 16 bit for Lands at 4/5 and Landsat 8 respectively. The software packages used for assessment were ERDAS IMAGINE 13 and ArcGIS 10.2.Change detection analysis on the seasonal basis (April to April and October to October) was carried out by visual interpretation of FCC created using four different band i.e. Red, Blue, Green and infrared band and further verified by NDVI calculations (Ichii, 2002, John, 1998, Paruelo, 1998and Ricotta, 2000).
In this study three different operations were performed. In the first operation, direct comparison (Singh, 1989 andDeer, 1999)
5. Results
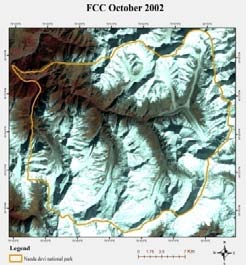
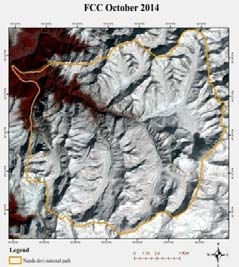
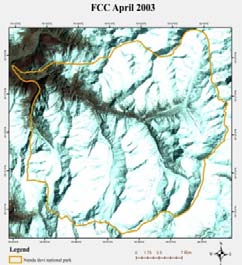
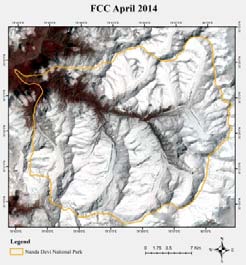
In the first operation visual interpretation of FCC produced from pre-monsoon images acquired on April 2003(figure 1a) and 2014 (figure 1b) and post monsoon images acquired on October 2002 (Figure 1c) and 2014 (Figure 1d) were compared. In this operation there was an increment in vegetation cover and snow cover (only in post monsoon image) and decrement in thickness of snow in latter images .
While in the second operation (which was performed to check the validity of the first one) visual interpretation of FCC produced from pre-monsoon images acquired on April 2003, 2014, 2015 and pre-monsoon images acquired on October 2002, 2014 and 2015(figure 2) all together were compared. Results of this operation were contradictory to the first operation results, i.e. no change in snow cover. This clearly indicates that the increment in snow cover in first operation was observed only because of early snow fall for that year at the time of image acquisition. This change is not land cover change but it is an artifact of technology.
But at the same time increment in vegetation cover was observed in both (first and second) the operations indicates an actual increment (more in pre monsoon images i.e. April). This increment in vegetation cover was also supported by NDVI calculations (figure 3) of imagery collected for both operations in entire time frame from 2002 to 2015.
As the interpretation about decrement of snow thickness produced by first operation was also not clearly validated here, therefore it requires a more focused study on it with some more clear and precise methodology.
IV.
6. Conclusion
As reported in the results of first operation there was an increment in snow cover is an example of over dependency on technology without knowing about facts. Take it as an example, in such cases technology without knowing about facts sometimes gives false information. Therefore, it must be required to validates and examine (using like in second operation of successive years' imagery compression) findings every time whenever reporting, our findings. And also requires to understanding about concepts properly prier interpret results and observation of any findings.
Similarly, in case of interpretation about increment in vegetation cover was cross checked and validated by second (i.e. Compression of imagery of successive years) and third (i.e. NDVI assessment of Vegetation) operations. This increment in vegetation cover was found in both successive years from 2003 to 2014 and 2015 and also using NDVI results validate each other. In this case one can says that if results of two different operations was found to be same then there are high chances of valid and error-less interpretations. The changes in vegetation cover (increased) can be result of conservation efforts during the time frame also validated by this study. V.
7. Acknowledgement
The study is conducted under a research project funded by ICIMOD with collaboration of Wildlife Institute of India (WII). First of all, we are thanking to director WII, ICIMOD of allowing me to do this study. We are also thankful to Dr. G S Rawat Scientist WII for their timely guidance support. We don't forget to thanks Dr. Panalal and our Lab mates GIS Lab WII, Dehradun for shearing their GIS knowledge and moral support whenever we needed. And in last we also thanking our friends, parents and almighty god.

| Lands at 8 |
| satellite image of the study area (Row: 39, Path: 145) |
| for April 2014 &2015 and October 2014 & 2015 |
| and Landsat 4-5 TM (Row: 39, Path: 145) image for |
| October 2002 and April 2003 were used. Sun |
| Elevationangle54.33, 63.25, 59.22, 46.13, 47.17, and |
| 43.57 for images April 2003, 2014, 2015, and October |
| 2002, 2014 and 2015 respectively. And Sun Azimuth |
| angle of 131.46, 126.55, 131.84, 150.52, 152.62 and |
| 153.42 for images April 2003, 2014, 2015, and October |
| 2002, 2014 and 2015 respectively. |