1. I. Introduction
lood modelling, prediction and its associated empirical results in a computational environment such as GIS compactible software give various avenue (ideas) in the design of Early Warning Systems for flood prediction and disaster management. The key challenge in developing a reliable Early Warning System for disaster mitigation is the development of modelling and simulation tools to accurately make flood predictions, simulate river channel breaching and flood propagation [6]. The 2007 flood has been the worst flood ever in history [20], where 56 people were killed and 332600 affected in Ghana alone according to [15].
The catchment is unluckily located in the driest region in Ghana with a very long dry season. The natives Year 2015 there fore farm quite close to the Black Volta. However during the rainy season, thunderstorm activities produce flash floods [10], inundating the farmlands and homes. It is important to harness the flood water for agriculture, industry, trade, etc., thereby reducing or preventing flood damages whilst benefiting from it as well. The study therefore uses HEC-HMS to compute the volume of water the catchment receives (and may hold) during such events for an analysis on the support for domestic and industrial (mainly agriculture) water demands of the region.
2. II. Study Area
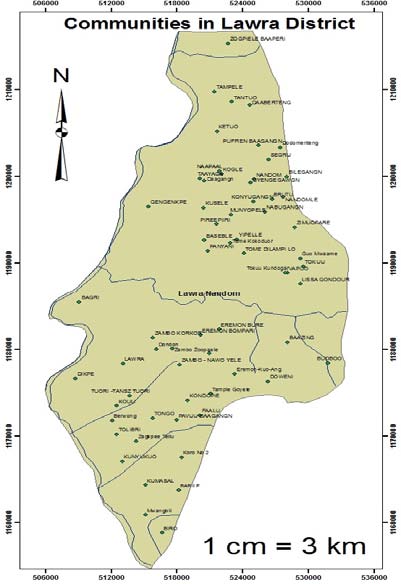
The Upper West region covers a geographical area of approximately 18,626.6 km 2 . This constitutes about 7.81% of the total land area of Ghana. It falls within the Black Volta Basin, the largest of the catchments in the Volta Basin with a total area of 142,056km 2 of which 33,302km 2 (23.5%) is located in Ghana, [11]. The guinea savannah vegetation of the region provides heterogeneous collection of trees for domestic requirements such as fuel wood and charcoal, construction of houses, cattle kraals and fencing of gardens. With dry and wet seasons, it is characterized by the cold and hazy harmattan weather from early November to latter part of March when the dry season begins and ends only with the onset of the early rainfall in April. The temperature of the region is between a low of 15 0 C at night time during the harmattan season and a high of 40 0 C in the day during the hot period of the harmattan. The area includes northern parts of Ghana, southern Burkina Faso and northern Cote D'Ivoire [3]. Figure 1 shows fairly the study area. Rainfall values from 1980-2011 were obtained for Wa, Babile, Tumu and Lawra as these are the four weather stations in the region. It was important for a regional distribution because precipitation formation is quiet localized. The Wa meteorological station is a synoptic weather station and suffices for the whole of upper west region thus it gives a good representation of temperature for the entire study area. Flow rates and discharges were also obtained for the same period from the hydrological services department. Experiments were performed to verify the discharge data since these data needed to be highly reliable as the hydrological modelling process depended on their accuracy. Equations 1 to 3, an adoption from [9], were used to verify the discharge values having performed morphology determination exercise severally, the averages were used in the equations. A good result was obtained indicating the degree of reliability of the data.
???????????????? ?????????????????? ?????????????? ???????? = ?????????????? ???????????? ???????????????? (?? ?????? ? ) 1 ?????????? ?????????? ?????????? ? ?????????????? ???????? (?? 2 ) × ?????????????? ?????????? ???????????????? (??/??????) = ?????????? ?????????? ????????????????? ?????????? ?????????? ????????????????? (?? 3 ?????? ? )???????????????????????????????? (0.8 ???? 0.9) ?????????????????? ?????????? ?????????? ????????????????? (?? 3 ?????? ? )3. b) Computing Runoffs and Volumes
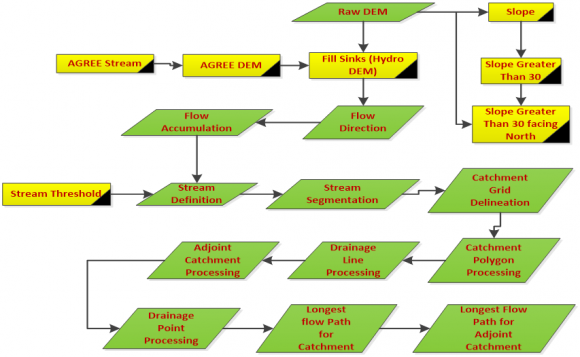
The HEC-HMS will give the runoffs at different height if a good model is constructed. Multiplying this with the area of inundation will give the volume of inundation. The area of inundation is obtained from delineating the watershed at the Dikpe outpour (pour point). The DEM generated is used as the base layer [4], in the Arc Hydro environment [7], and a delineation process conducted. The procedure is shown in Figure 2. Hydrological models are based on a set of interrelated equations that convert the physical laws, which govern extremely complex natural phenomena, to abstract mathematical forms, [1]. Different varieties of models can be used, depending upon the conceived output, the existing database, input variables and required analysis [5]. [12], suggests the rainfall-runoff models can be classified according to their degree of representation of the physical processes and to the spatial and temporal description [8], although hydrologic models are approximations of reality, so the output of the actual system can never be forecasted with certainty. Likewise, hydrologic phenomena vary in all three space dimensions, and in time, but the simultaneous consideration of all five sources of variation (randomness, three space dimensions, and time) has been accomplished for only a few idealized cases [17]. Hydrological model as shown in Figure 3 emphasizes some aspects which are considered relevant instead of considering them as of secondary importance, and should be sufficiently comprehensible and easy to be used and sufficient to represent the physical studied problem [16].
The understanding of the dynamics of the rainfall runoff process constitutes one of the most important and challenging problems in hydrology. The main reason for modelling hydrological processes is the limitation of hydrological measurements [2]. At a local scale the processes are lumped up and depending on conditions prevailing (along the Black Volta in the Lawra district), the physical processes is better represented as in Figure 3.
4. ii. Modelling in the HMS Environment
In this environment a basin model is created, by describing the watershed, to convert atmospheric conditions into stream-flow at specific locations in the watershed. Flow ratios were chosen to increase or decrease the computed flow by a fixed ratio and applied only to sub-basin and source elements once the flow ratios are turned on. Each sub-basin and source can have a separate ratio, or no ratio. An alternative is to use Missing inflow where data for an element can be set to zero. Climate is one indicator of the probability of the types of runoffs that will occur in a given watershed. However, in arid regions the flow on smaller watersheds is nearly always surface runoff. Surface runoff or overland flow occurs when the rainfall rate is greater than the infiltration rate.
The model is designed by placing onto the user interface, hydrologic elements. Hydrologic elements are the basic building blocks of a basin model. An element represents a physical process such as a watershed catchment, stream reach, or confluence. Each element represents part of the total response of the watershed to atmospheric forcing. The various elements are connected to describe the physical watershed. Each link in the network is a one-way connector that takes outflow from an element and connects it as inflow to a downstream element. Figure 4 shows the modelled basin with hydrologic elements in HEC-HMS.
Next is a runoff-volume model where the Kinetic Wave is chosen because it fits the natural behaviour of river flows. The Soil Conservation Service (SCS) Curve Number (CN) models estimates precipitation excess as a function of cumulative precipitation, soil cover, landuse, and antecedent moisture, using the following equation, [13]:
?? ?? = (?? ? ?? ?? ) 2 ?? ? ?? ?? + ??Where P e = accumulated precipitation excess at time t; P = accumulated rainfall depth at time t; I a = the initial abstraction (initial loss); and S = potential maximum retention, a measure of the ability of a watershed to abstract and retain storm precipitation.
5. Figure 4 : HEC-HMS Basin Model of Hydrologic Elements
Until the accumulated rainfall exceeds the initial abstraction, and the precipitation excess, the runoff will be zero. From analysis of results from many small experimental watersheds, the SCS has developed an empirical relationship of I a and S: ?? ?? = 0.2??, thus substituting gives;
?? ?? = (?? ? 0.2??) 2 ?? + 0.8??Incremental excess for a time interval is computed as the difference between the accumulated excess at the end of and beginning of the period. The maximum retention, S, and watershed characteristics are related through an intermediate parameter, the curve number (commonly abbreviated CN) as:
?? = ? 1000 ? 10???? ???? 25400 ? 254???? ???? ?The bottom equation is evaluated in SI units. CN values range from 100 (for water bodies) to approximately 30 for permeable soils with high infiltration rates. The channel routing model uses the momentum equation and the continuity equation known as St. Venant equations and accounts for forces that act on a body of water in an open channel, taking into account the shape of the channel, [14].
The models are based on data from 1980-2010 with 2011 data serving as a test year for the models. during the flood years resulted in flow rates above 1000m 3 /s. In the same vein annual rainfall recorded in these years are above 1000mm, recorded within the rainy season of March to November with very high probability of occurrence. Values from the remaining three months sum up to an insignificant factor to the annual total and therefore can confidently be ignored or included in the analysis. They were included though and the raw annual rainfall totals have been used as the amount that could cause flood.
6. IV. Results and Discussion
Dikpe is mainly savannah with alluvium soils. These give a curve number of 87 which correspond to S value of 1.49 This is an indication that runoffs over land will have heights above 38.897in for ordinary flood and above 47.654in for worse flood events according to history if we expect similar events or worse. From Table 4, with 2009 as the reference year, the volume of flood water is 31,313,221.5m 3 for the months August to October as opposed to 36,065,515.89m 3 for the entire year. This forms 86% of the total for the year which gives a degree of rainfall intensity and frequency within the three month period of the year. Forecasted annual rainfall values for 2012 ranges from 1011.8mm-1247.8mm using percentage growth method and moving average method respectively. A 13.2% percentage change has a return period of between 6.97 -8.9 years, thus in every 7-8 years there will be a repeat of conditions of referenced year. Thus in 2016 or/ and 2017, there is going to be a repeat of the 2009 flood event or worse. Figure 5 shows the flooded area within the Dikpe catchment when there is a runoff height of 1.134m or 44.652in.
7. V. Conclusion
The model provides the runoff volumes in column 4 of Table 1 in inches. This is an indication that runoffs over land will have heights above 38.897in for ordinary flood and above 47.654in for worse flood events (according to history) if we expect similar events. Forecasted annual rainfall values for 2012 ranges from 1011.8mm -1247.8mm using percentage growth method and moving average method respectively. Rainfall amount likely to cause flood (from the model) are annual average intensities above 1000mm. According to the model the Black Volta River catchment receives above 31,012,782.27m 3 of water during flood events and this could be harnessed to meet the water demand of the district.
8. VI. Acknowledgements
Thanks to Tibla Sandow of Meteorological Department in the Upper West region for helping in obtaining rainfall and temperature values for four weather stations in the region for the study period. We also express gratitude to Ebenezer Allotey of the Hydrological Services Department, Accra in assisting us to obtain flow rates and discharges for the study.

![Figure 2 : Flowchart of Terrain Processes i. Modelling the Runoff ProcessesHydrological models are based on a set of interrelated equations that convert the physical laws, which govern extremely complex natural phenomena, to abstract mathematical forms,[1]. Different varieties of models can be used, depending upon the conceived output, the existing database, input variables and required analysis[5].[12], suggests the rainfall-runoff models can be classified according to their degree of representation of the physical processes and to the spatial and temporal description[8], although hydrologic models are approximations of reality, so the output of the actual system can never be forecasted with certainty. Likewise, hydrologic phenomena vary in all three space dimensions, and in time, but the simultaneous consideration of all five sources of variation (randomness, three space dimensions, and](https://socialscienceresearch.org/index.php/GJHSS/article/download/1373/version/100869/2-Computing-Flood-Volume-of-Dikpe_html/12909/image-3.png)
![Figure 3 : Systems diagram of the runoff process at local scale (after [18]).](https://socialscienceresearch.org/index.php/GJHSS/article/download/1373/version/100869/2-Computing-Flood-Volume-of-Dikpe_html/12910/image-4.png)
| ?? = | (?? ? 0.2??) 2 ?? + 0.8?? | ????, |
| in inches results in a runoff of 44.652in, and for 2007, | ||
| 41.145in. The channel capacity of the Black Volta is | ||
| 21,085,440m 3 up to the Dikpe outlet, which means it can | ||
| hold water to that capacity. Table 1 gives water volumes, | ||
| obtained by multiplying runoff height by area of | ||
| 31,798,197.75m 2 (3.18km 2 ), above which signifies the | ||
| excesses that caused flood. These values are greater in | ||
| 1995, 1999, 2005 and 2009 implying that the flood | ||
| events in these years were much severe. All these years | ||
| have rainfall intensities above 1100mm, indicating that | ||
| rainfall above 1000mm and runoff above 38inches will | ||
| cause flood in the Dikpe community. The model | ||
| provides the runoff volumes in column 4 of Table 1 in | ||
| inches. | ||