Application of AHP Model in Selection of Most Appropriate Area to Establish Soil Damp
for Artificial Recharge of Underground Aquifers (Case Study: Tabas Basin)
ran is one of the arid countries in second world arid continent means Asia The average
of world annual rain is almost 860 millimeter. While this numbe in our country is
almost 250 millimeter and in Yazd province is almost 61.2 millimeter that means less
of ¼ average Iran's rain and less of ¼ average world rain (Ahmadi, 2006) .of course, this amount in consecutive years wouldn't access in steady process and
this irregularity in frame work of arid and torrential rains cause wore damage to
human and physical environment relative to quantity. Yazd province as a third province
content of critic focus for windy erosion after Kerman and Khorasan for reason of
region abnormality such as decreasing rainfall and increasing temperature Severely
involved with this phenomenon and desert consecutive such as subsidence of underground
water sources. Thus it is necessary satiable program which in this way could control
one of the biggest obstacles developments (Ali zadeh, 2003). Drought is a generally occurring phenomenon which its effects intensify gradually.
In some cases drought continues for longer time and causes destructive damages to
human communities. During recent years climate change impacts have been combined with
drought effects and caused serious problems in different parts of the World. Characteristics
of a drought event are not often easily known until it occurs. During 1967 to 1992,
about 50% of the 2.8 billion people who suffered from all natural disasters, have
been affected by relatively sever drought. From 3.5 million people who were killed
by disasters, about 1.3 million were victims of the drought (Obasi, 1994). About 50% of the World intensive populated regions containing the most agricultural
lands are very vulnerable to the drought (USDA, 1994). Since these resources are 99%
of whole available fresh water, it is necessary to determine and exploit the ground
water (Kouthar, 1986-19). Furthermore, it includes 80% of being used resources in arid and semi-arid areas
in most countries (Sedaghat, 1994). Due to Iran`s situation in desert and semi-desert area and its average annual rainfall
about 250 mm, so there were many ways to prepare fresh water for agriculture, drinking
and industry in different parts of country from a long time ago. Therefore, determination
and zoning the most appropriate area for artificial recharge of underground aquifers
should be considered in this plain. There are many examples of applications of artificial
recharge of ground water in literature For instance: Saraf and Choudhury (1998) used
remote sensing capabilities in extracting different layers like land usage, geomorphology,
vegetation, and their integration in GIS environment to determine the most suitable
area for artificial recharge of ground water. Mahdavi (1997, 16) investigated water management and artificial recharge of ground water in Jourm city
and indicated that controlling usage and recharge of water tables by the watershed
management is the main management technique. Abdi and Ghayoumian (2001, 86) prioritized
the suitable areas for storing surface water and reinforcing ground water based on
geophysics data, land usage, topography, their integration and analysis in GIS environment.
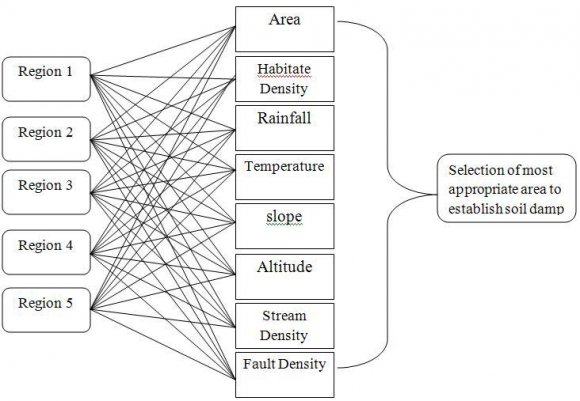
The purpose of this study is Application of AHP Model in Selection of most appropriate
area to establish soil damp for artificial recharge of underground aquifers.
2. II. Methods and Materials
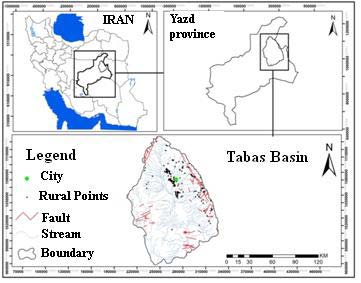
a) Mathematical situation of studied area Tabas Basin with 5056/9 KM2 Being situated
in the Yazd Province, Tabas Basin is bounded by 33º, 15' latitude to 33º, 57' north
latitude and 56º, 25' to 57º and 23' longitude (Figure 1). Firstly, studied area was investigated by the satellite images of Google Earth
and its limitations were determined. Then digital elevation model of area was separated
from its digital elevation model in Iran in the environment of soft ware Global Mapper
and the output was received. Required data layers for zoning in the environment of
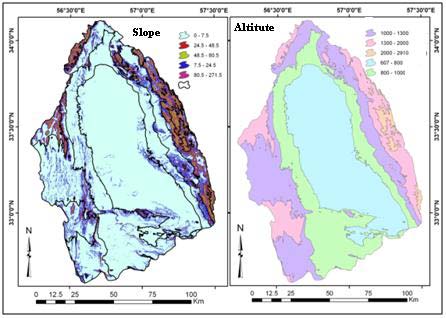
software Arc GIS 9.3 was prepared as following: First, digital elevation model classified
in to 5 elevation classes based o natural breaks in the heights of the area. Mentioned
classes represent the studied zones in the area and subsequent calculations were done
in each of these classes. Slope layer prepared base on digital elevation model on
the area by surface analyses tool in 3D analyses. There were different processes to
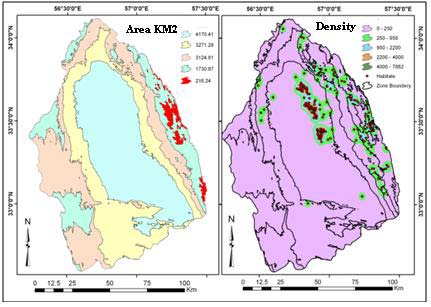
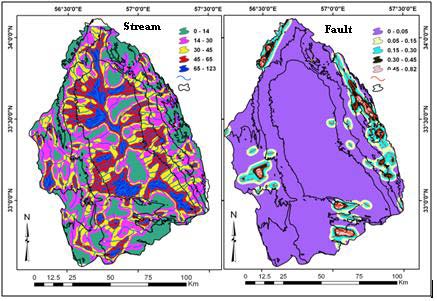
prepare drainage density layer and habitual density such as digitizing main and minor
waterways layers on the topographical map1:50000 of the area, digitizing main and
minor fault on geological map 1:100000 of area and density tool in Spatial Analyses.
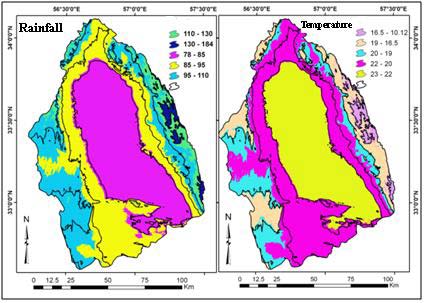
Iso-Precipitation layer prepared by interpolating method like cringing technique and
linear relationship between rain-height using Interpolate tools in 3D analyses . Second,
the investigated criteria for each height zones were calculated and their layers prepared
separately. After achieving a few numbers in each layer, the numbers were analyzed
by AHP method. Then considered watershed was ranked to select the best area for establishing
soil damp. The Analytic Hierarchy Process (AHP) is an approach that is suitable
for dealing with complex systems related to making a choice from among several alternatives
and which provides a comparison of the considered options. This method was first presented
by Saaty (Saaty, 1980). The AHP is based on the subdivision of the problem in a hierarchical
form. The AHP helps the analysts to organize the critical aspects of a problem into
a hierarchical structure similar to a family tree. By reducing complex decisions to
a series of simple comparisons and rankings, then synthesizing the results, the AHP
not only helps the analysts to arrive at the best decision, but also provides a clear
rationale for the choices made. The objective of using an analytic hierarchy process
(AHP) is to identify the preferred alternative and also determine a ranking of the
alternatives when all the decision criteria are considered simultaneously (Saaty,
1980). Process steps are as follows:
Step 1 : building a hierarchy. Step 2: determining the coefficients of the importance
standards and sub-criteria: To determine the coefficients (weights) of the criteria
and sub-criteria to compare the two to two. Judgment based on the quantitative comparison
table below (Table 1). Step 3: Preparation of paired comparisons matrices and normalization factors: Then
the values for each pairwise comparison matrix columns together and each element in
matrix paired comparisons were divided into the sum of a column that normalized the
paired comparison matrix normalized (Equation 1). Then calculate mean of the elements in each row of the matrix that results in is
created normalized weight vector (Equation 2).
r ij = a ij ? a ij m i=1(1)W i = ? r ij n i=1 n(2)
In these equations m: number of columns, n: number of rows, aij: paired comparison
of matrix elements rij: Options for normalization of matrix elements i, j index i,
and Wi: weight of i-th item.
Step 4: Determine the final score factors (preferences and priorities): At this stage,
the fusion coefficients are determined by the final score of each of the options.
For this purpose, can be used the hierarchical composition of the resulting priority
vector with respect to all judges at all levels of the hierarchical (Bertolini et
al, 2006; Moreno-Jiminez et al, 2005) .
In other words, the final score of each of the routes be determined of the sum of
the coefficients of integration options and criterion (Equation 3).
V H = ? W k ?g ij ? n k=1
In this respect is: VH: My final choice j, WK: The weight of each criterion and gij:
weighing the options regarding the criteria.
Step 5: Calculate the compatibility or incompatibility system: To calculate the rate
of adaptability must first paired comparison matrix (A) of the weight vector (W) is
multiplied to obtain a good approximation of ? max W ? max W that is A × W = ? max
W. Dividing the ? max value of ? max W of W is calculated. Then inconsistency index
is calculated of the equation ( 4
3. IV. Discussion
The analytical hierarchy procedure (AHP) is proposed by Saaty (Saaty, 1980). AHP was originally applied to uncertain decision problems with multiple criteria,
and has been widely used in solving problems of ranking, selection, evaluation, optimization,
and prediction decisions. The AHP method is expressed by a unidirectional hierarchical
relationship among decision levels. The top element of the hierarchy is the overall
goal for the decision model. The hierarchy decomposes to a more specific criterion
in which a level of manageable decision criteria is met (Mianabadi & Afshar, 2008]. Under each criteria, sub-criteria elements related to the criterion can be constructed.
The AHP separates complex decision problems into elements within a simplified hierarchical
system (Limon & Martinez, 2006). The AHP usually consists of three stages of problem solving: decomposition, comparative
judgment, and synthesis of priority. The decomposition stage aims at the construction
of a hierarchical network to represent a decision problem, with the top level representing
overall objectives and the lower levels representing criteria, subcriteria and alternatives.
With comparative judgments, expert users are requested to set up a comparison matrix
at each hierarchy by comparing pairs of criteria or sub-criteria. Finally, in the
synthesis of priority stage, each comparison matrix is then solved by an eigenvector
method for determining the criteria importance and alternative performance. The purpose
of the AHP Method in this paper is Application of AHP Model in Selection of most appropriate
area to establish soil damp for artificial recharge of underground aquifers. The results
of AHP method for This Purpose showed in tables (3) to (13) and figures (7,8).
4. V. Conclusion
Decision making problem is the process of finding the best option from all of the
feasible alternatives. In almost all such problems the multiplicity of criteria for
judging the alternatives is pervasive. That is, for many such problems, the decision
solve a multiple criteria decision making (MCDM) problem. A survey of the MCDM methods
has been presented by Hwang and Yoon (Hwang, 1981). The analytic hierarchy process (AHP) is one of the extensively used multi-criteria
decision-making methods One of the main advantages of this method is the relative
ease with which it handles multiple criteria. In addition to this, AHP is easier to
understand and it can effectively handle both qualitative and quantitative data. The
use of AHP does not involve cumbersome mathematics. AHP involves the principles of
decomposition, pairwise comparisons, and priority vector generation and synthesis.
Though the purpose of AHP is to capture the expert's knowledge, the conventional AHP
still cannot reflect the human thinking style. Therefore, fuzzy AHP, a fuzzy extension
of AHP, was developed to solve the hierarchical fuzzy problems. In the fuzzy-AHP procedure,
the pairwise comparisons in the judgment matrix are fuzzy numbers that are modified
by the designer's emphasis. The findings of the research show that zone 3 with 0/3606
points promotes in first rank among 5 studied zones and thus it is the most appropriate
zone for Artificial Recharge of ground waters, in contrast zone 5 with 0/1731 point
goes down to the last rank and so it isn`t suitable for Artificial Recharge and zones
(2,4,1) are located in next ranks.
Application of flood development methods in artificial recharge of,
Ahang Kouthar
. 1986.
Ali Zadeh
, A
. principals of applied hydrology, 16th print,
2003. p. 233.
Emmam Reza University publication
Multiple Attributes Decision Making Methods and Applications,
C L Hwang
, K Yoon
. 1981. Berlin Heidelberg: Springer.
AHP is intended for more than expected value calculationS.
E Forman
. Decision Sciences1990. 36 p. .
H Ahmadi
. applied geomorphology,
2006. 2.
desert -wind erosion, Tehran University publication
Consistent weights for judgment matrices of the relative importance of alternatives.
J Barzilai
, W Cook
, B Golany
. Operations Research Letters1987. 6 p. .
Power relations and group aggregation in the multiplicative AHP and SMART.
J Barzilai
, F A Lootsma
. Journal of Multi-Criteria Decision Analysis1997. 6 p. .
A clarification of 'Remarks on the Analytic Hierarchy Process.
J Dyer
. Management Science1990. 36 p. .
The theory of ratio scale estimation: Saaty's analytic hierarchy process.
P Harker
, L Vargas
. Management Science1987. 33 p. .
On a shortcoming of Saaty's method of analytic hierarchies.
V Belton
, T Gear
. Omega1983. 11 p. .
The legitimacy of rank reversal -a comment.
V Belton
, T Gear
. Omega1985. 13 p. .