1. Introduction
his paper uses information from European household surveys from 1996 to 2013, to assess the effects of education on earnings. In particular, the focus is on how degree-level education affects earnings -to investigate the 'valence hypothesis' suggested in Simister (2014). There seems widespread agreement that education is desirable, for the individual and for society, but the benefits of a degree may not be obvious if we look at a group of recent graduatessome recent graduates are likely to be unemployed, and other graduates to be in low-paid jobs. The valence hypothesis suggests we should not expect immediate results from a degree: it might take several years for a graduate to acquire the firm-specific skills which an employer values. To make a more reliable assessment of the effects of education on productivity, it may be appropriate to take a longer-term view, by investigating a sample of graduates who left university several years ago. If most graduates eventually obtain higher-paying jobs (compared to non-graduates), then the skills learnt at university (such as using computers, researching, and writing essays) seem beneficial. And if most graduates obtain a higher pay (relative to nongraduates), it seems likely that this higher pay is associated with higher productivity -which implies the degree generally gives benefits to the graduate's employer, and hence to society as a whole. Education would then be a useful investment for society; perhaps justifying bursaries for gifted students from poor backgrounds (West et al., 2009). The key question Author: MMU Business School, United Kingdom. e-mail: [email protected] this paper addresses is: does education give long-term benefits? II.
2. Literature Review
Many authors have commented on the importance of education to provide economic progress (e.g. Simister, 2011a). If education increases wages, this suggests education also increases productivity (assuming employers would not pay more to hire graduates, unless graduates were more productive than non-graduates). A few writers disagree, claiming that education should be seen as a 'signal', in that qualifications imply a person has desirable qualities such as being hard-working and intelligent; but empirical evidence generally supports the view that education increases productivity (Rohling, 1986;Simister, 2011b). Holland et al. (2013: 7) wrote "The empirical literature typically finds a positive relationship between education and GDP growth", a view supported by Organisation for Economic Co-operation and Development (2012: 68). 'Human capital theory' is a widely-accepted approach in economics, which claims education confers skills on students (van der Merwe, 2009). Holland et al. (2013: 56) report that there seems to be a gradual effect of education on economic growth (measured by Gross Domestic Product): the long-run adjustment of an economy is gradual, with about 5 to 15% of the increased education being absorbed into the economy per year. Their regression methodology used an 'error-correction' approach, under the hypothesis that there is a long-term link between education and economic growth.
Empirical analysis by Simister (2014) focused on delayed effects of education, and suggested the hypothesis that a graduate's earnings increase not smoothly, but in two steps. The first step seemed to occur about 3 years after leaving education; and the second step about 7 or 8 years after leaving education. Simister (2014) reported steps in the apparent effects of training graduates: a pattern visible in microeconomic data from the 'British Household Panel Study', and in macroeconomic data on many countries from the World Bank.
Some writers suggest a country should increase the productivity of its workers, in order to be internationally competitive (e.g. Cockburn Gordon, 2009) imply education may be a positive-sum game, in which all countries can benefit. For example, we would be better able to implement new resources such as mobile phones incorporating computers and satellite navigation, electric vehicles, and 3D-printers if our citizens are more educated. Computer skills can increase productivity (Bapna et al., 2013). However, unlike Holland et al. (2013), the valence hypothesis does not predict a steady rise in productivity after an increase in the number of graduates in an economy.
Previous research has found state spending on education helps economic growth (Hanushek and Wößmann, 2007: 7). Holland et al. (2013: 8) conclude that increasing education of graduates, and the resulting increase in productivity, contributed to about 20% of GDP growth in the UK from 1982 to 2005. However, education spending tends to be less than optimal (Barr, 2004: 344), and hence state subsidy of university education is appropriate. The need to borrow money to pay tuition fees seems to discourage school-leavers from attending university (Callender& Kemp, 2000: 91; Metcalf, 2003: 324). Hence, evidence in this paper is relevant to the debate on how much a government should subsidise education.
The remainder of this paper investigates the 'valence hypothesis'. This hypothesis appears to support 'human capital theory', because it implies a university education tends to have a long-term effect on wages (and, presumably, on productivity).
3. III.
4. Data and Methods
This paper uses data from the 'EuroBarometer' (EB) series of household surveys, carried out by the European Commission, and made available via Gesis (2014). EuroBarometer surveys aim to assess public opinion in Europe, on topics such as energy use in the European Union; the Euro currency; and the desirability of new countries to join the EU. EuroBarometer surveys also include a number of 'background' variables, often called demographic variables, such as age and gender of the respondent; these background variables are the basis for this paper.
For this paper, the term 'education level' is to represent the person's qualifications, using the 'International Standard Classification of Education' (ISCED), shown in Table 3 below. EuroBarometer report this data for three surveys from 2010; I recode similar education data on Sweden and Norway, to match -as far as possible -the ISCED categories. However, such data are not available in most EB surveys, so a proxy is used. EB surveys ask the respondent "How old were you when you stopped full-time education?" This, subtracted from the respondent's age, tells us how long ago the respondent left education -and acts as a measure of the respondent's education level: it is assumed that any respondent who left university at the age of 23 years or older has tertiary education, and is referred to in this paper as a graduate; whereas anyone who left education younger than 23 years of age is classified as a non-graduate. This indirect assessment is far less reliable than the ISCED classification. People still in full-time education are removed from this analysis. This paper uses two forms of information about earnings: personal income, and household income. The preferred form of data is personal income (variable D15E in EB), because this is the best measure of whether tertiary education raises wages. Unfortunately, only one of the 103 EB surveys used for this paper includes (gross) personal income: EB 67.3, in 2007, which gives a sample of 9,339 people. Another form of income data is household income, which has the advantage that it is available for many EB surveys from 1996 to 2004. To increase the link between household income and the respondent's education, the household income variable (D29) is used to limit the sample of people to households where the respondent said he/she is the main income earner for the household -this provides evidence on 276,260 respondents from thirtyseven EB surveys. In some households, household income is reported as zero -in such households, household income is not used for this paper.
One (Gesis, 2014). Each survey is intended to be representative of the countries covered. EuroBarometer survey data files include various variables for use as weights, but findings in this paper are unweighted (hence, results in this paper are not necessarily representative of the European Union as a whole). Combining surveys for this paper produced a very large sample: over two million people -note, however, that some variables analysed in this paper are only included in a few of the EuroBarometer surveys.
author's analysis of D31b (not included in this paper) indicates that where the respondent said he/she is the main earner in their household (in question D19b), the main income source for their household is employment (as opposed to other sources such as pensions or state benefits). Hence, household income used in association with variable D19b may be a reasonable proxy for the respondent's income. Within the UK, the wage premium for graduates is higher than average, at about 160 per cent relative to workers without formal educational qualifications".
It would be helpful to understand steps in graduate pay (after leaving university) in Charts 1 and 2; one possible explanation is promotion. Chart 3 allows us to assess this, by considering whether graduates are likely to be promoted after about 3 or 7 years after leaving education. For Chart 3, graduates are classified into four groups: unemployed; managers; professionals; and other employed people (these add up to 100%).
Source: EB surveys,1996 to 2013. Chart 3 : Employment Status, by Years Since Leaving Education (Respondents Who Left Education Over 22) seems to be a transition about year 2: falling unemployment from about 20% to about 8%, accompanied by an increase in normal (i.e. neither professional nor management) jobs. There is a small rise in the fraction of respondents calling themselves 'professionals', about 4 to 6 years after leaving university; and a steady rise in the fraction of graduates who are 'managers', from about 6 to 8 years after graduation. These changes seem consistent with the valence hypothesis -suggesting pay-rises about 2 years after graduation are due to graduates getting a low-paid job, and the second upward transition in pay at about 7 to 8 years is due to a shift from a low-paid job to a better-paid job (professional or managerial).
Chart 2 uses household income to assess a respondent's income (limiting data to respondents who are the main earner in their household). Among graduates, pay increases from zero to two years after graduation; followed by a plateau, then a step from year 5 to 6; and there is a further step from year 9 The first steps confirm the valence hypothesis; Simister (2014) did not report the third step from year 9, but it seems consistent with Chart 1. Perhaps the valence hypothesis should be revised to include three steps, rather than two -but more research is needed before we can be confident. More evidence is shown in Chart 4, regarding graduate pay in three types of job (normal, professional, and managerial); there seems to be a pay rise for 'other workers' (i.e. not professionals or managers) and managers in the first few years after graduation, although this does not appear to be a sudden step. About six years after graduation, there is increasing pay among professionals; this could be explained by people being promoted to a professional job, or by people who already have a professional job receiving a pay-rise. The fall in managers' pay at year 6 suggests some managers become professionals, but why should this apparently reverse the following year? In the UK, we might interpret rising professionals' pay 6 years after graduation in terms of passing profession exams such as CIMA or ACCA to become qualified accountants, or to become solicitors or medical professionals; but these details may vary from one country to another, and the sample of (for example) accountants in one country may be too small to rely on.
5. IV.
6. Conclusions
This paper investigates the 'valence hypothesis', which claims there is usually a delay between a person graduating from higher education, and the corresponding increase in his/her earnings. This delay seems to be of several years; and it may consist of two steps. However, the Charts in this paper are not entirely clear; another data source might prove more effective than EuroBarometer surveys, to test the valence hypothesis. The evidence presented in this paper suggests the valence hypothesis is worth pursuing, but more research is needed before we can feel confident about the hypothesis.
There is a large body of previous research which demonstrates the beneficial effects of education on economic progress. This paper supports the mainstream view, in that graduates are better-paid than non-graduates suggesting education raises productivity. The 'valence hypothesis' adds to this literature, because much of the previous empirical work did not allow for possible delayed effects of education; hence, much of the previous research may have underestimated the beneficial effects of education.
This paper supports the claim that education can help Europe escape the current long-term recession which began around 2007. The UK government since 2010 attempted to put the cost of higher education onto students; many young adults in Britain chose to invest in their own education (a wise choice: this paper makes clear that graduates tend to earn more than nongraduates). But the current UK loan scheme may turn out to be more expensive than offering financial support for students, and it seems likely that tuition fees of around £9,000 per year will have discouraged many Britons from going to university (Crawford et al., 2014: 5). Other European countries have no reason to be complacent: Europe seems to be falling behind more forward-looking countries such as USA. According to World Bank (2014), 94.3% of young adults in USA took some form of tertiary education in 2012, compared to 79.6% in Denmark, 61.9% in UK, and 61.7% in Germany.
Freeman & Van Reenen (2009: 7) claim there is not enough private investment in education or researchincreased government spending seems appropriate; the state should intervene to ensure an egalitarian outcome (Zajda, Majhanovich and Rust, 2006: 10). Education is beneficial.
7. Bibliography


| To compare data from different countries, data |
| in each currency is converted to the equivalent value in |
| Euros using Eurostat (2014b) and Eurostat (2014c): |
| 'Purchasing Power Parity' exchange rates using Eurostat |
| (2014d). To control for inflation between surveys, |
| monthly 'Consumer Price Index' data (set as 100 in |
| 2005) from Eurostat (2014a) is used for this paper. |
| Hence, all income data are in Euros, at 2005 prices. |
| The earliest monthly CPI data in Eurostat |
| (2014a) is |
| Average age at which the | Number of people | |
| Year of interview | respondent left education | Interviewed |
| 1996 | 17.6 | 121,703 |
| 1997 | 17.6 | 57,757 |
| 1998 | 17.7 | 43,294 |
| 1999 | 17.8 | 58,143 |
| 2000 | 17.8 | 43,078 |
| 2001 | 18.0 | 103,419 |
| 2002 | 17.9 | 104,330 |
| 2003 | 18.1 | 102,863 |
| 2004 | 18.5 | 87,269 |
| 2005 | 18.4 | 177,819 |
| 2006 | 18.4 | 180,550 |
| 2007 | 18.4 | 127,357 |
| 2008 | 18.5 | 78,055 |
| 2009 | 18.6 | 205,943 |
| 2010 | 18.9 | 204,329 |
| 2011 | 18.8 | 204,945 |
| 2012 | 19.0 | 155,796 |
| 2013 | 19.0 | 133,413 |
| Source: EuroBarometer surveys 44.2 to 80.1 (author's analysis) | ||
| A noticeable feature of Table 1 is that the | ||
| average age at which people leave education rose from | ||
| about 18 years in 1996, to about 19 years in 2013. This | ||
| is a small change over such a long time-scale, and may | ||
| explain why Europe seems to have had disappointing | ||
| economic performance in recent years: for example, | ||
| most European countries have had little growth in | ||
| national income since the global financial crisis around | ||
| 2007. In some countries, such as UK, government | ||
| austerity measures in the last few years seem to be | ||
| harming education. For example, Rowlands (2008: 95) | ||
| reports closure of several science departments in UK | ||
| universities. Other sources expressing concern about | ||
| closures of science & engineering departments include | ||
| Milkround (2004). Lefrere (2007: p. 204) suggested that | ||
| in Europe, only élite universities can obtain sufficient | ||
| funding for science & engineering equipment: middle- | ||
| ranked and low-ranked European universities are now | ||
| becoming less able to compete with Chinese | ||
| universities. | ||
| EuroBarometer | Year of | Countries which include | Sample size |
| Survey | Interview | data on education level | (all countries) |
| 46.1 | 1996 | Sweden | 886 |
| 52.1 | 1999 | Norway | 978 |
| 54.2 | 2001 | Norway | 1015 |
| 56.1 | 2001 | Norway | 1032 |
| 73.2 | 2010 | 26 countries & Iceland & Norway | 27,552 |
| 73.3 | 2010 | 26 countries & Iceland &Norway | 27,524 |
| 75.4 | 2011 | 26 countries | 26,072 |
| TOTAL | 85,059 | ||
| Source: EuroBarometer (author's analysis) | |||
| Most EuroBarometer surveys do not include the | |||
| respondent's education level: it was asked in seven | |||
| surveys, listed in | |||
| Education level | Average age the respondent | Number of people |
| of respondent | left full-time education | interviewed |
| Primary education or first stage of basic education | 13.5 | 7,419 |
| Lower secondary or second stage of basic education | 16.1 | 13,189 |
| (Upper) secondary education | 18.7 | 29,969 |
| Post-secondary, non-tertiary education | 20.5 | 7,560 |
| First stage of tertiary education | 24.1 | 16,523 |
| Second stage of tertiary education | 26.0 | 1,566 |
| Source: EuroBarometer surveys 46.1, 52.1, 54.2, 56.1, 73.2, 73.3 & 75.4 (author's analysis) |
| uses education level of the respondent, |
| based on the ISCED classification. Table 3 indicates |
| that on average, people with 'tertiary education' (often |
| called higher education: usually representing graduate |
| or postgraduate-level education) tend to leave |
| education later -typically at 24 or 26 years of age. |
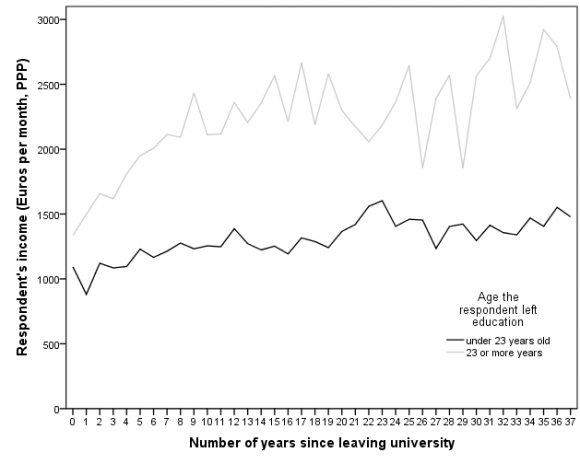
| Chart 1 reports EuroBarometer respondents' |
| earnings. The horizontal axis shows the time between |
| leaving education and being interviewed; it extends to |
| 37 years, excluding respondents who left full-time |
| education over 37 years ago (if graduation occurs about |
| 24 or 26 years old, as Table 3 suggests, 37 years takes |
| most graduates close to retirement age). |