1. Introduction
apping enables professionals to understand complex spatial relationships visually so as to plan effectively and efficiently. Similarly, Hirschfield et al (1995) estimated that nearly 80% of the information need of local health system decision and policy makers involves geographical positioning. Health mapping utilizes the technology of Geographic Information Systems to add value to information for public health planning and decision making. Geographical Information Systems (GIS) provides useful techniques regarding capturing, maintaining and analyzing of spatial data.
The role of monitoring and evaluation is that of coordinating all activities in order to create an efficient and aesthetically pleasing physical environment for all forms of human activities in order to create an environment which has quality of acceptable standards for health and efficiency, and which enable individuals, families and communities to live and work in a satisfactory manner (Vagale, 1971).
Attention is focused here on the spatial distribution of health care facilities of Millennium Development Goal Projects, which are Boreholes, Primary Health Centers (PHCs) and Ventilated Improved Pit (VIP) latrines in Kaduna North and South local government areas of Kaduna state, Nigeria. This is viewed with keen interest because it pertains to one of MDGs goals, which has been the development of the rural and urban areas under the Direct Relief Grant (DRG) Scheme Program aimed at providing sustainable water and hygiene to the public. As a result, there is the need for accurate mapping and monitoring of the spatial distribution of health care facilities of the Millennium Development Goals (MDGs) projects in Kaduna North and South Local Governments.
In Kaduna North and South Local Governments, few health care facilities were located very far away in the headquarters of the Local Governments with few rural areas that having Primary Health Centers that were ill-equipped and under staffed. Some communities covered long distance to seek medical services (MDG Report Card, 2008). Therefore, the mapping and monitoring of the health care facilities will provide an opportunity for maintenance and effective distribution and re-distribution of the health care facilities, so as to create a new landscape that will bring about lasting solution to the problem of health care delivery in the study area. In the light of the above, one expects that the health care facilities under the MDGs project would be made available to an extent, especially the basic amenities of life such as safe drinking water and hygienic environment.
In view of the above, the study therefore identified and mapped health care facilities of the MDG available in Kaduna North and South Local Government Areas with the view to monitor health care delivery in the study area. National Planning Commission (2006) stated that the rural populace in developing countries has been suffering from different kinds of deprivation yet; they constitute the bulk of the population, which is about 75% in Nigeria. For effective and functional health care delivery, spatial data is required on location and changes taking place within and around the communities to be able to carry out planning. Hence, there is a need to introduce scientific mapping technique that would reveal the impact and essence of mapping and monitoring the health care facilities. And this scientific technique is Geographic Information System (GIS).
Conditional Grant Scheme (CGS) is a federal government of Nigeria support from the Debt Relief Gains to the lesser tiers of governments to scale up and assist in improving Primary Health Centers (PHC), Water and Sanitation among others to meet up with the MDG goal number one (MDGs Report Card, 2008).
Several studies were conducted in which GIS was used to identify environmental indicators and spatial location of health facilities such as the GIS-based application shown in a study of access to health care facilities when geographic information was used to link data from a population-based survey with an independently sampled health facility survey (Hong, 2006). Onsi, (2004) also used remote sensing and GIS technology to identify health facilities and delineate associated health risks, demonstrated the practical and successful application of remote sensing and GIS in assisting decision-making for health and development and the effectiveness of map making.
2. II.
The Study Area
3. Materials and Methods
The data types used in this study are topological base map of Kaduna North and South Local Governments sourced from the archive of the Department of Geography, Ahmadu Bello University, Zaria. The coordinate information of the health care facilities was sourced using the GPS on the field. Apart from the coordinate data, the researcher also assessed the conditions of the health care facilities. This was important in complementing the data collected from MDGs Office (names and addresses of the health care facilities). There were twenty three (23) health care facilities in the study area out of which sixteen (16) were boreholes, four (4) were Primary Health Centers (PHC) and three (3) were Ventilated Improved Public Toilets (VIPs).
The health care facilities coordinate data collected from the field using GPS were plotted on the base map that has been scanned, geo-referenced and layers extracted. All data gathered were analyzed using Ilwis 3.2a GIS Software. The analyzed data are presented using tables and maps.
IV.
4. Results and Discussion
The health care facilities identified in the study area are in three categories. They are the Primary Health Centers (PHC), the Boreholes and the Ventilated Improved Pit (VIP). This is shown in Table 1. Table 1 shows that the number of boreholes identified were sixteen (69.56%), Primary Health Centers (PHC) were four (17.39%) and Ventilated Improved Toilets (VIP) were three (13.04%). The total numbers of the healthcare facilities of the MDGs were twenty three (23).
From the observation of the researcher, the PHC were all constructed by the MDG and were in good status. They were beneficial to the host community. The PHCs were located at Kabala Doki and Badarawa all in Kaduna North L.G.A. The Ventilated Improved Toilet (VIP) of the Health care facilities of the MDGs were also in good working condition and located in Kaduna North L.G.A. It is evident that most of the Health Care facilities of the MDGs were located at the North-Western section (Kaduna North LG.A) The databases, which were created in tabular formats, are presented in Tables 2, 3 and 4. The database carries basic information about the attribute data of the Health Care facilities ranging from their local government location, stations, coordinates, and status (working condition). Table 2 shows the total number of boreholes of MDGs, addresses and their respective geographical locations. Out of the sixteen (16) boreholes, seven (7) were not rehabilitated and not in good working condition. Most of the boreholes were located in Kaduna South L.G.A.
The Primary Health Centres and VIP toilets were very few in number as seen in tables 3 and 4 compared to the number of boreholes. The PHC were four (4) and the VIP toilets were just three (3). The VIP toilets were entirely located in Kaduna North local government area while the PHCs were equally located in both local government areas. They were also in good working condition and beneficial to the host community. Source: GIS Analysis.
5. ( B )
Year 2014
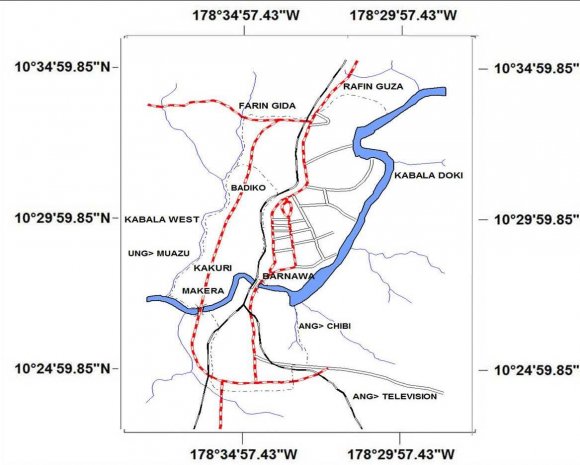
The spatial locations of the Health Care Facilities of the MDGs were plotted on the base map of the study area to produce the map (figure 2). The map shows the extent of the distribution of the Health Care Facilities of the MDGs within the study area. Most of the Health Care Facilities of the MDGs were spatially located at the North-Western section of the study area.
V.
6. Conclusion
GIS provides a reliable base for mapping health care facilities with regular information updating. Distribution of Health Care Facilities remains a problem in Nigeria particularly in rural areas. There were no detailed working plans and criteria for the provision of healthcare facilities at the local level peculiar to the need of the generality of the people in the past. The challenge of health care delivery at the local level is how to get physical planners and communities involvement in decision regarding the location and distribution of health care facilities. This will enhance the provision of health care facilities in locations which are accessible to the generality of the populace. GIS however, will solve the problem of adequate spatial distribution of Health Care Facilities.
Due to the ever increasing number of population, more health care facilities need to be provided. In terms of "status", there were problems of malfunctioning of some of the Health Care facilities most especially the boreholes. Some of them were not well maintained and some not working at all. There are three important factors that affected the level of accessibility of the facilities. These were the capacity of the facilities, the demand for the facilities and the transportation network that communicated such demand to the relevant capacity. A good network of transportation provided easy access to these Health Care facilities. The study area had a good network of transportation with most of the Health Care Facilities spatially located in proximity to roads, railways and even part of the River Kaduna course.
Based on the strength of this study, it is recommended that 5km should be the service radius through which a Primary Health Centre (PHC), VIP Toilet and borehole should be provided. Based on the above service radius, one PHC will be provided in every community of every ward in the study area; one VIP toilet will be provided in every community of every ward in the study area; one borehole will be provided in every community of every ward in the study area. And this will help in meeting the MDG that is targeted with the provision of the health care facilities in the first place.


| Projects in the study area. | ||
| S/N Health Care Facility | Absolute No Percentage | |
| 1 Primary Health Centers | 4 | 17.39 |
| 2 Boreholes | 16 | 69.56 |
| 3 VIP latrines | 3 | 13.04 |
| TOTAL | 23 | 100.00 |
| Source: MDGs report card, 2008 | ||
| S/No | L.G | Station | Coordinates Gps Lat. (E) | Coordinates Gps Long.(N) |
| 1 2 | Kaduna North Kaduna North | Farin Gida Hayin Banki | 10 34' 46.4'' 10 o 34' 40.8'' o | 07 o 26' 39.1'' 07 o 25' 05.6'' |
| 3 | Kaduna North | Angwan Yero | 10 o 33' 22.9'' | 07 o 26' 16.8'' |
| 4 | Kaduna North | Kwaru | 10 o 33' 58.3'' | 07 o 27' 41.0'' |
| 5 | Kaduna North | Rafin Guza | 10 o 35' 17.4'' | 07 o 28' 06.5'' |
| 6 7 | Kaduna North Kaduna South | Ungwan Dosa Down Quarters | 10 o 34' 13.0'' 10 o 29' 05.7'' | 07 o 27' 40.0'' 07 o 24' 52.6'' |
| 8 | Kaduna South | Makera | 10 o 28' 21.2'' | 07 o 24' 34.2'' |
| 9 10 | Kaduna South Kaduna South | Kinkinau Kabala West | 10 0 29' 07.8'' 10 o 30' 14 0'' | 07 o 24' 12.0'' 07 o 23' 39.0'' |
| 11 12 | Kaduna South Kaduna South | Ungwan Sanusi Kasuwar-Barchi | 10 o 31' 42.9'' 10 o 31' 0.9'' | 07 o 24' 34.0'' 07 o 24' 40.2'' |
| 13 14 | Kaduna South Kaduna South | Tudun Ilu Badiko | 10 o 30' 39.5'' 10 o 32' 04.2'' | 07 o 25' 02.8'' 07 o 24' 38.0'' |
| in 2008. |
| LGAs in 2008 |