1. I. Introduction
ne of the economic development problems in modern economies is the evolution of disparity and spatial variations in development levels, which is becoming a feature of the economic structure of developed countries as well as countries that didn't achieve growth and economic development. It is seem in the form of proliferation of poverty forms and the emergence of social exclusion, in contrast of what world is witnessing of technological and cognitive revolution.
The override of traditional spatial economy concept based on the cost of transport and distance, and abundance of natural resources provided to the poor area's opportunities to build their economic structure, which is developmental approach to assert an evolution and achieve economic efficiency in the creation of production dynamics. Some applied experiences in countries suggest to impel an excel progress that economic productivity activities, in some places that are characterized by the scarcity of natural resources like silicon Valley in USA and in India, as well as the spatial development of mountain regions in China, which intended to align economic and social activities through the development of capabilities and capacities, which aims to create a spatial gravity investments areas. in addition to the efficient use of resources and reduce spatial disparities and spatial variation and creating a kind of homogeneity in the development levels.
The study of spatial heterogeneity could help policy makers to guide development work by identifying the degree of symmetry and homogeneity in spatial areas specificities and therefore directing and managing economic and social public policies more effectively.
Our empirical analysis thus investigates the heterogeneity between municipalities in saida city, which details the differences and spatial variations, in order to see the convergence of the space between these municipalities due to its importance in the development through the direction of public policy, as required by the spatial characteristics of geographic areas, away from dependence on policy. stereotypes (public) that does not take into account the specificity of each region.
2. II. Litterateur Review
The aim of this section is to illustrate important results from several studies about spatial heterogeneity and their impact in development process, in first spatial heterogeneity which is related to the differentiation of variables and behaviors in space also it is one of spatial econometric that helps study spatial convergence or divergence between area in this space like the studies that deals with spatial heterogeneity (Catarina Cardoso & al, 2011) this study aims to examine the importance of human capital in the process of convergence between economic regions,The researcher used Spatial Econometrics models ,While spatial systems can be observed in groups convergent include the differences between them and this convergence incarnated in two types of convergence absolute and conditional, occurs mainly in the peripheral group of regions, while human capital represented by the average years of total, secondary and higher education plays a positive role only in the Core club of the richest regions but not in the Periphery, which suggests that a certain level of economic development is required to achieve a positive effect of human capital.
(Marie-Estelle BINET& al, 2013) This study aims to analyze the determinants of behavior entrepreneur-ship creation including spatial heterogeneity by using dynamic panel data model to explain the number of firms created in each region. The results of estimation in this study indicate that any attempt to reduce regional unemployment must address regional labour market specificities. and also highlight the role of decentralized territorial collectivities in implementing specific regional policies.
(Julia´n Ramajo & al.2008).In this paper, Researchers studied the importance of spatial heterogeneity and dependence to the European regions problems by using the ? -convergence process, to explain Heterogeneity and spatial autocorrelation who has impact on convergence between regions. in addition to evaluating the role of spatial cohesion to achieve real regional convergence according to European standards. The results figure out the importance of spatial effects that can give a new perceptions regarding to the European regional convergence policies.
The area in the EU is characterized by specifities. through the presence of disparity in income levels, geographical location and convergence that contributes to the interpretation of economic regions growth model in European Union.
(Cem Ertur et Wilfried Koch,2004) This study is to analyze regional inequalities by using spatial Exploratory Data Analysis that allows to show the relationship between the level of wealth of a region with its location and the level of average wealth neighboring regions , This research concluded that measuring and addressing regional inequalities in the future Union European appears much more complex than the simple mechanism of movement of arithmetical mean and European policy should also take into account the geographic location and structure of neighboring of each European regions.
(Julie Le Gallo, 2000) presented in their study the different methods to modeling the phenomenon of spatial autocorrelation and spatial heterogeneity and also presented the estimation and inference Procedures adapted to the models incorporating these two effects. This study was a purely Empirical, and Concluded that the simultaneous presence of spatial autocorrelation and spatial heterogeneity in a model requires estimation methods and inference adapted .
In other study (Julie Le Gallo.2004) which focused on the specificities of quantitative methods for study spatial heterogeneity and spatial autocorrelation. Also to explain at what extent can change traditional statistical tests one should take into account the effect of autocorrelation of spatial data, which are defined as non-independent. This study concluded that the impact of autocorrelation and heterogeneity at the same time several times due to the large number of links that unifying the two phenomena that require estimation and inference more convenient than traditional statistical tests, which can't be applied in case where there are two effects (spatial autocorrelation and spatial heterogeneity).
3. III. Research Methodology
In this section, we will in first introduce the data selected for empirical analysis, then we will develop the empirical methodology (PCA, Clusters, Panel data) to studying the heterogeneity from the spatial data for some economic variables to see homogeneity or heterogeneity between these geographical areas, this method has great importance in studying the unobserved heterogeneity.
Principal component analysis (PCA) is a method for detecting patterns in data and to emphasize similarities and differences in variables. PCA reduces the dimension of the data, that is, attempts to reduce the number of variables to analyze without much loss of information.
Cluster analysis is a numerical technique that is suitable for classifying a sample of heterogeneous observation in a limited number of groups, each of which is internally homogeneous in terms of the similarities between the observation that Comprise it. (Sergio Tezanos Vázquez & al, 2012).
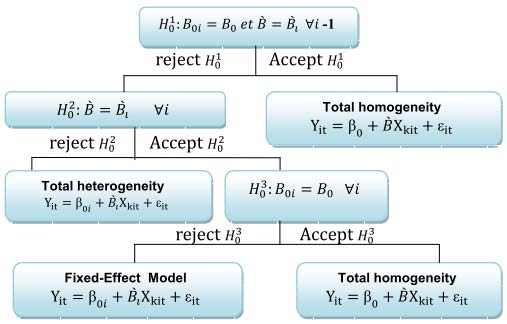
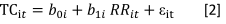
The Objectives of homogeneity tests tries to find out how specification (homogeneity and heterogeneity) unobserved before determining the panel data structure. in economic terms, these tests indicate that we can assume that theoretical models to study economic phenomena are homogeneous for observation study. or there are a specificities that characterized each observation study (Christophe HURLIN), It has been suggested by Hsiao (1986) to make this test on the frame of sequential steps tested according to the following hypothesis (Régis Bourbonnais, 2011): The variables That we have used to build regression model concerning the study Of Spatial unemployment between the municipalities (16 municipalities of saida city) and has been estimated this model which combines between some independent variables wealth variable ratio (RR),unemployment variable (TC), total population in each municipality (POP).
4. IV. Empirical Modeling Result a) Principal component analysis
Before our application of the PCA method, In a first stage, the PCA method is applied to the variables. The (KMO=0697) measure and Bartlett's Test of Sphericity suggest that the application of the PCA method provides good results for this data analysis. the first component accounts for 72,866% of the variance of the data. second explains 17.95% of the total variance and the third explains 7.166%(Table01),in total of accumulated variance 97.986%. almost similar to results of the Principal component analysis as sited above, we will to make sure for this result, We try to examine the spatial heterogeneity between municipalities Proceeding from application of homogeneity tests by studying homogeneity of Unemployment across the municipalities .which reflect indirectly the nature and size of economic activity in the municipalities.
5. c) Models characterization tests
These tests are intended to find out how specialization (homogeneity and heterogeneity) that are unclear before you select structure of panel Data ( panel structure ).
6. i. First Model
The first model is to study the phenomenon of unemployment as a variable depends on wealth ratio variable (RR), and total population of each municipality (POP) and we can write the model as The Fisher statistical value is given Under Hypothesis as sited above :
?? 1 = (SCR c1 ? SCR)/(N ? 1)(k + 1) SCR/?N × T ? N(k + 1)?We reject the hypothesis H 0 1 if :
?? 1 > ?? (??.(???1)(??+1).?N×T?N(k+1)?Through the estimation of global model, we find the value of Fisher under Hypothesis as follows:
Estimation of partial models to calculate the residual sum of squares for each model is given by : ? SCR ? SCR=5828, 34717 Through the use of Fisher statistical value, we obtain : The ficher statistique is given whith following form :
?? 1 = (24990?? 2 = (SCR c2 ? SCR)/((N ? 1) × k) SCR/?N × T ? N(k + 1)? the hypothesis ?? 0 2 is rejected if ?? 2 > ?? (??.(???1)×??).?N×T?N(k+1)?Through the estimation of fixed effects model, we find the value of Fisher as follows: therefore the hypothesis H20 was rejected and there is a total heterogeneity.
From this result, we can say that there is heterogeneity between observation studied by the unemployment rate model and their explanatory variables.
7. ii. Second Model
The second model is to study the phenomenon of the unemployment rate as a variable dependent variable wealth ratio (RR), of various municipalities and this second is to try to eliminate the effect of population on the change in the unemployment rate model Where Where t=1 , : .??.13 , Time period, From this result, we can say that there is heterogeneity between observation studied by the unemployment rate model and their explanatory variables.
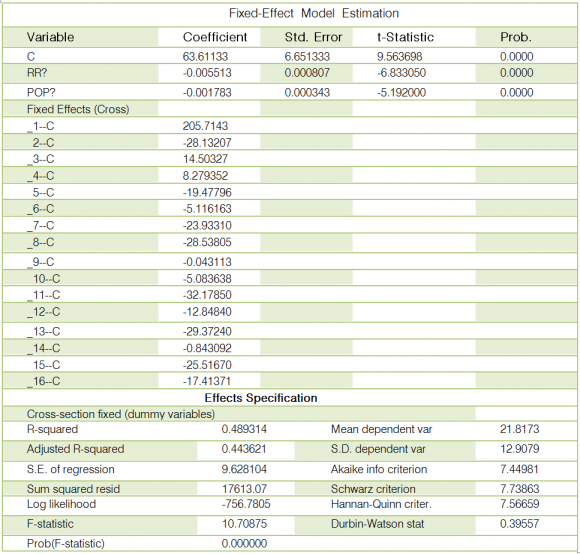
on the basis of the foregoing analysis noted there is heterogeneity between different spatial data (spatial heterogeneity), This heterogeneity refers in mathematical terms to differences in the coefficient models studied, which leads to the inability to estimate individual models has the fixed effects and random effects models also because the data does not have a panel structure (the panel structure) but in economic Table 7 : Fixed-Effect model Estimation terms refers to differences in economic and social spatial data, which is why there is a difference between the municipalities of saida city. Which must be brought to public development policies as spatial characteristics of each municipality far from typical and overall development programs.
8. V. Conclusion
The effectiveness to achieve profitability of economic activities and their spatial distribution requires the study of the characteristics and components of geospatial areas that must be taken into account in the spatial construction of economic structure , in order to create spatial interaction among poor areas and areas that have the potential (natural and economic)resources that can distinguish and increase their competitiveness in the context of reducing development disparity and fight against economic and social inequality.
this study of heterogeneity help to explain the behavior of economic variables in space to help decision makers to guide productive development works and investment that leads to the efficient allocation of resources to ensure sustainability.
9. VI. The Study Recommendations
Through of this article that we have written by studying of spatial heterogeneity, which is reflected in economic realities of the existence of inequality and contrast in levels of economic and social development, for this and we decided to make recommendations that include: ? Necessity to Dependence on a proposed local development programs take into account specificities of each region (municipality) Apart from the standard and typical strategies adopted in most municipalities in Algeria, which explain why Algerians did not attain the objectives of the local development programs. ? Achieving spatial development requires the use of spatial planning of economic, social and human resources with more effective coordination among the parties to the development work. ? Create some sort of balance between urban and rural areas in the distribution of productive economic activities and investment, which could help reduce disparities in development and poverty reduction because generally rural areas are often a concentrations whith higher levels of poverty and exclusion. ? give importance to quantitative methods in the study of economic phenomena (the distribution of economic activities in the geographical areas, homogeneity and spatial heterogeneity, spatial interaction ... etc) as tools for decision making to achieve growth and spatial economic and social development.


| Extraction Sums of squares | Sum of squares of factors | ||||||||
| Initial Eigen values | retained factors | retained to the rotation | |||||||
| % | %of | % | % of | ||||||
| Components | Total %of variance | cumulated Total | variance | cumulated Total | variance %cumulated | ||||
| First component 12,695 | 79,346 | 79,346 | 12,695 79,346 | 79,346 11,659 72,866 | 72,866 | ||||
| Second | 1,930 | 12,064 | 91,411 | 1,930 | 12,064 | 91,411 | 2,873 | 17,954 | 90,820 |
| component | |||||||||
| Third component | 1,052 | 6,576 | 97,986 | 1,052 | 6,576 | 97,986 | 1,147 | 7,166 | 97,986 |
| Source: Prepared by the authors | |||||||||
| The first component: explains the value of | Third component: explains about7.166% of the | ||||||||
| 72.866% of the explained variance and includes 13 | explained and variance includes a Saida municipality, | ||||||||
| municipalities (Second component: explains about 17.954 % | this component represent urban concentration component. b) Clustering of municipalities | ||||||||
| of the explained variance and includes 02 municipalities | |||||||||
| (Maamoura, Ain skhouna) and represents and forestry | |||||||||
| component. | |||||||||
| Observation | Cluster 4 | Cluster 3 Cluster 2 | |
| adiaS | 1 | 1 | 1 |
| Dhoui Thabet | 2 | 2 | 2 |
| Ain alhadjar | 2 | 2 | 2 |
| delahk deluO | 3 | 2 | 2 |
| ibral yaluoM | 2 | 2 | 2 |
| buoY | 2 | 2 | 2 |
| tenuoH | 2 | 2 | 2 |
| rama idiS | 2 | 2 | 2 |
| ruekbuob idiS | 2 | 2 | 2 |
| ansassaH | 2 | 2 | 2 |
| aruomaaM | 2 | 2 | 2 |
| demha idiS | 4 | 3 | 2 |
| anuohks niA | 2 | 2 | 2 |
| miharb deluO | 2 | 2 | 2 |
| enicriT | 2 | 2 | 2 |
| Aenatlos ni | 2 | 2 | 2 |
| Source: Prepared by the author | |||
| This result indicate that saida municipality | Cluster 1: Includes, Hounet, Youb, Moulay larbi, | ||
| belong to the first group Whatever to the groups | khaled Ouled, Dhoui thabet, Sidi amar, Hassasna | ||
| distribution. And also we observed that Hounet, Youb, | Sidiboubkeur, Maamoura, Ainskhouna, ouled Ibrahim, | ||
| Moulay larbi, Sidi boubkeur, Hassasna ,maamoura.ain | Tircine, Ain soltane that are characterized by its | ||
| Skhouna, Ouled ibrahim, Tircine, ain soltane, Sidi Amar, | agricultural character | ||
| Dhoui Thabet, municipalities are belong to the second | Cluster 2 : include the Sidi ahmedmunicipality | ||
| groups Whatever to groups distribution. Whereas sidi | which is characterized by pastoral character and | ||
| ahmed municipality is belong to the fourth group If we | production of livestock. | ||
| divided into four groups. And also belong to the third | Cluster 3 : Includes Saida municipality Which is | ||
| group If we divided into three groups. We can | characterized for being a large geographical concentra- | ||
| summarize these results as follows: | tion compared to other municipalities, This result is | ||
| Year 2014 | ||||||
| 27 | ||||||
| I | ||||||
| Version | ||||||
| VIII | ||||||
| RR | Variable | Coefficient -0.006230 | Std. Error 0.000716 | t-Statistic -8.702093 | Prob. 0.0000 | Issue |
| POP C | 9.50E-05 26.41743 | 2.70E-05 1.118294 | 3.514288 23.62299 | 0.0005 0.0000 | XIV | |
| R-squared Adjusted R-squared S.E. of regression | 0.275420 0.268351 11.04096 | Mean dependent var S.D. dependent var Akaike info criterion | 21.8173 12.90790 7.65542 | Volume | ||
| Sum squared resid | 24990.09 | Schwarz criterion | 7.70355 | |||
| Log likelihood F-statistic Prob(F-statistic) | -793.1637 38.96120 0.000000 | Hannan-Quinn criter. Durbin-Watson stat | 7.67488 0.27230 | Global Journal of Human Social Science | ||